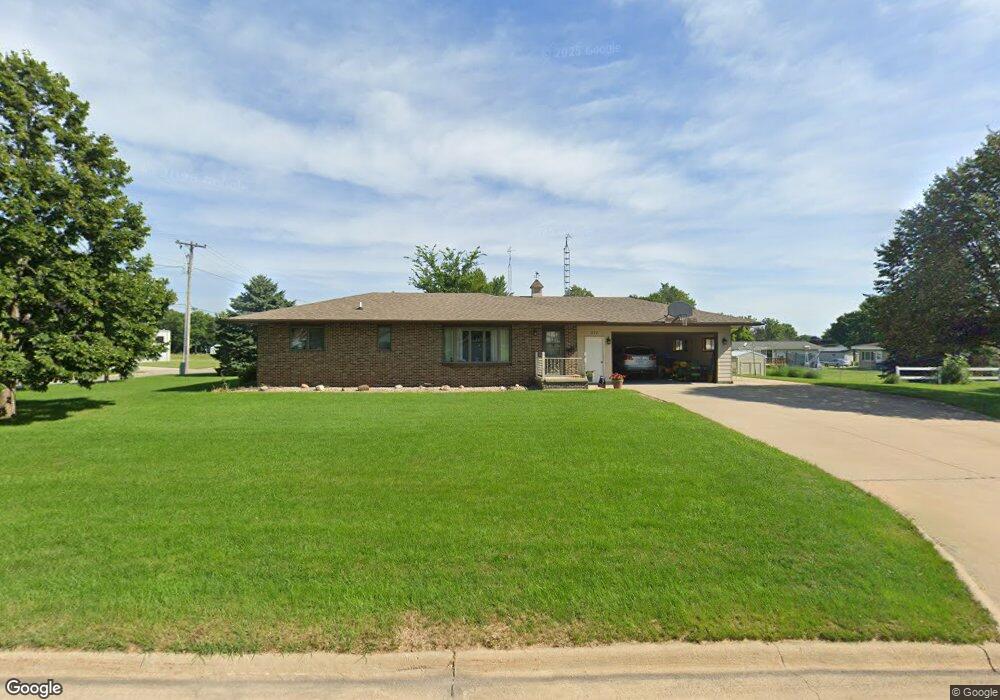
711 11th St Charles City, IA 50616
Estimated Value: $165,629 - $211,000
2
Beds
4
Baths
1,144
Sq Ft
$162/Sq Ft
Est. Value
About This Home
This home is located at 711 11th St, Charles City, IA 50616 and is currently estimated at $185,407, approximately $162 per square foot. 711 11th St is a home located in Floyd County with nearby schools including Charles City High School and Immaculate Conception School.
Ownership History
Date
Name
Owned For
Owner Type
Purchase Details
Closed on
Oct 27, 2023
Sold by
Wiegmann Maida M
Bought by
Venz Ronald M and Venz Marilyn S
Current Estimated Value
Purchase Details
Closed on
Sep 30, 2010
Sold by
Glandon Pauline E and Glandon Pauline E
Bought by
Meyer Diane L and Glandon Janice D
Purchase Details
Closed on
Sep 13, 2010
Sold by
Estate Of Kenneth D Glandon
Bought by
Glandon Pauline E
Create a Home Valuation Report for This Property
The Home Valuation Report is an in-depth analysis detailing your home's value as well as a comparison with similar homes in the area
Home Values in the Area
Average Home Value in this Area
Purchase History
| Date | Buyer | Sale Price | Title Company |
|---|---|---|---|
| Venz Ronald M | $225,500 | None Listed On Document | |
| Venz Ronald M | $225,500 | None Listed On Document | |
| Meyer Diane L | -- | None Available | |
| Glandon Pauline E | -- | None Available |
Source: Public Records
Tax History Compared to Growth
Tax History
| Year | Tax Paid | Tax Assessment Tax Assessment Total Assessment is a certain percentage of the fair market value that is determined by local assessors to be the total taxable value of land and additions on the property. | Land | Improvement |
|---|---|---|---|---|
| 2025 | $1,884 | $146,570 | $22,630 | $123,940 |
| 2024 | $1,884 | $138,160 | $22,630 | $115,530 |
| 2023 | $2,072 | $138,160 | $22,630 | $115,530 |
| 2022 | $2,062 | $110,520 | $22,630 | $87,890 |
| 2021 | $2,086 | $110,520 | $22,630 | $87,890 |
| 2020 | $2,086 | $110,520 | $22,630 | $87,890 |
| 2019 | $2,304 | $130,120 | $19,220 | $110,900 |
| 2018 | $2,146 | $120,040 | $19,220 | $100,820 |
| 2017 | $2,076 | $120,040 | $19,220 | $100,820 |
| 2016 | $2,034 | $120,040 | $19,220 | $100,820 |
| 2015 | $2,034 | $114,230 | $19,220 | $95,010 |
| 2014 | $2,082 | $114,230 | $19,220 | $95,010 |
Source: Public Records
Map
Nearby Homes