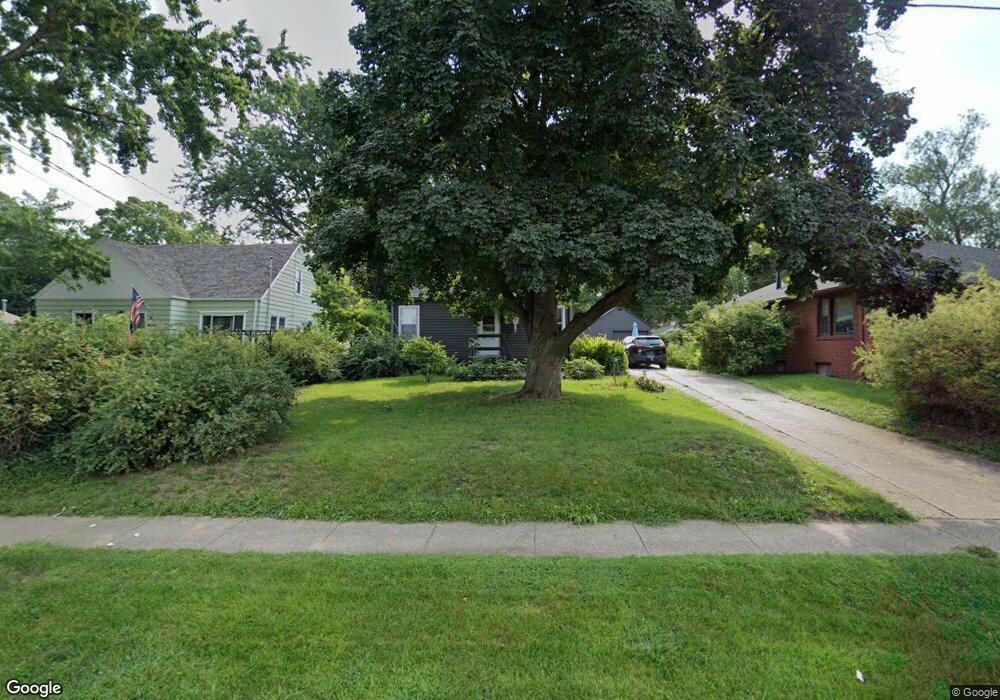
711 12th St West Des Moines, IA 50265
Estimated Value: $196,000 - $218,608
3
Beds
1
Bath
905
Sq Ft
$227/Sq Ft
Est. Value
About This Home
This home is located at 711 12th St, West Des Moines, IA 50265 and is currently estimated at $205,152, approximately $226 per square foot. 711 12th St is a home located in Polk County with nearby schools including Hillside Elementary School, Stilwell Junior High School, and Valley Southwoods Freshman High School.
Ownership History
Date
Name
Owned For
Owner Type
Purchase Details
Closed on
Jul 15, 2014
Sold by
Dougherty Kevin S
Bought by
Dougherty Kevin S and Dougherty Jennifer L
Current Estimated Value
Purchase Details
Closed on
Oct 14, 2009
Sold by
Reams Darrell E and Reams Gloria A
Bought by
Dougherty Kevin S
Home Financials for this Owner
Home Financials are based on the most recent Mortgage that was taken out on this home.
Original Mortgage
$94,261
Outstanding Balance
$61,771
Interest Rate
5.15%
Mortgage Type
FHA
Estimated Equity
$143,381
Create a Home Valuation Report for This Property
The Home Valuation Report is an in-depth analysis detailing your home's value as well as a comparison with similar homes in the area
Home Values in the Area
Average Home Value in this Area
Purchase History
| Date | Buyer | Sale Price | Title Company |
|---|---|---|---|
| Dougherty Kevin S | -- | None Available | |
| Dougherty Kevin S | $95,500 | None Available |
Source: Public Records
Mortgage History
| Date | Status | Borrower | Loan Amount |
|---|---|---|---|
| Open | Dougherty Kevin S | $94,261 |
Source: Public Records
Tax History
| Year | Tax Paid | Tax Assessment Tax Assessment Total Assessment is a certain percentage of the fair market value that is determined by local assessors to be the total taxable value of land and additions on the property. | Land | Improvement |
|---|---|---|---|---|
| 2025 | $2,644 | $192,600 | $64,900 | $127,700 |
| 2024 | $2,644 | $177,300 | $59,100 | $118,200 |
| 2023 | $2,698 | $177,300 | $59,100 | $118,200 |
| 2022 | $2,664 | $148,600 | $51,000 | $97,600 |
| 2021 | $2,548 | $148,600 | $51,000 | $97,600 |
| 2020 | $2,506 | $135,700 | $46,400 | $89,300 |
| 2019 | $1,960 | $135,700 | $46,400 | $89,300 |
| 2018 | $1,960 | $104,200 | $40,700 | $63,500 |
| 2017 | $1,866 | $104,200 | $40,700 | $63,500 |
| 2016 | $1,822 | $96,800 | $37,300 | $59,500 |
| 2015 | $1,822 | $96,800 | $37,300 | $59,500 |
| 2014 | $1,728 | $91,300 | $34,500 | $56,800 |
Source: Public Records
Map
Nearby Homes
Your Personal Tour Guide
Ask me questions while you tour the home.