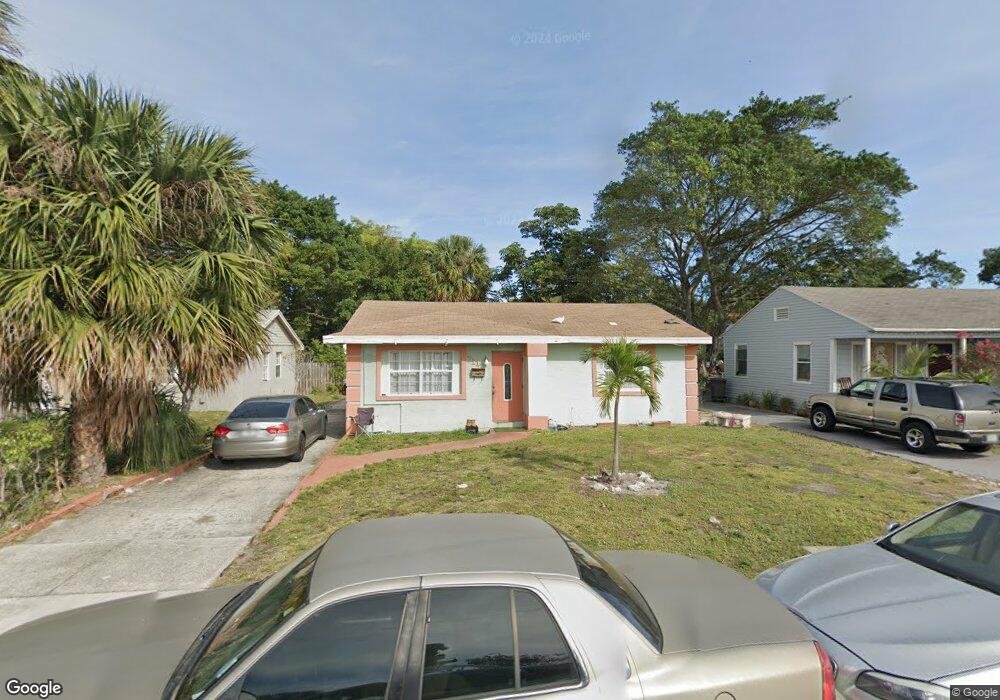
711 42nd St West Palm Beach, FL 33407
Northwood Hills NeighborhoodEstimated Value: $341,000 - $495,000
2
Beds
1
Bath
1,575
Sq Ft
$248/Sq Ft
Est. Value
About This Home
This home is located at 711 42nd St, West Palm Beach, FL 33407 and is currently estimated at $390,757, approximately $248 per square foot. 711 42nd St is a home located in Palm Beach County with nearby schools including Palm Beach Lakes High School, Ephesus Adventist Academy, and The Foundations School at Center for Creative Education.
Ownership History
Date
Name
Owned For
Owner Type
Purchase Details
Closed on
Jul 1, 1994
Sold by
Economy Home Bldr Inc
Bought by
Mckenney Surfunia and Porter Alton
Current Estimated Value
Purchase Details
Closed on
Nov 1, 1993
Sold by
Housing & Urban Dev
Bought by
Economy Home Bldr Inc
Home Financials for this Owner
Home Financials are based on the most recent Mortgage that was taken out on this home.
Original Mortgage
$24,000
Interest Rate
6.97%
Purchase Details
Closed on
Jun 1, 1993
Sold by
Alliance Mtg Co
Bought by
Housing & Urban Dev
Create a Home Valuation Report for This Property
The Home Valuation Report is an in-depth analysis detailing your home's value as well as a comparison with similar homes in the area
Home Values in the Area
Average Home Value in this Area
Purchase History
| Date | Buyer | Sale Price | Title Company |
|---|---|---|---|
| Mckenney Surfunia | $55,000 | -- | |
| Economy Home Bldr Inc | $24,100 | -- | |
| Housing & Urban Dev | -- | -- |
Source: Public Records
Mortgage History
| Date | Status | Borrower | Loan Amount |
|---|---|---|---|
| Previous Owner | Economy Home Bldr Inc | $24,000 |
Source: Public Records
Tax History Compared to Growth
Tax History
| Year | Tax Paid | Tax Assessment Tax Assessment Total Assessment is a certain percentage of the fair market value that is determined by local assessors to be the total taxable value of land and additions on the property. | Land | Improvement |
|---|---|---|---|---|
| 2024 | $431 | $31,694 | -- | -- |
| 2023 | $407 | $30,771 | $0 | $0 |
| 2022 | $387 | $29,875 | $0 | $0 |
| 2021 | $365 | $29,005 | $0 | $0 |
| 2020 | $352 | $28,605 | $0 | $0 |
| 2019 | $341 | $27,962 | $0 | $0 |
| 2018 | $278 | $27,441 | $0 | $0 |
| 2017 | $238 | $26,877 | $0 | $0 |
| 2016 | $225 | $26,324 | $0 | $0 |
| 2015 | $221 | $26,141 | $0 | $0 |
| 2014 | $222 | $25,934 | $0 | $0 |
Source: Public Records
Map
Nearby Homes
- 4301 Pinewood Ave
- 0 Broadway Unit F10486451
- 4108 Greenwood Ave
- 4400 Greenwood Ave
- 4008 Greenwood Ave
- 4010 Greenwood Ave
- 808 41st St
- 620 46th St
- 531 45th St
- 707 46th St
- 3906 Greenwood Ave
- 4300 Spruce Ave
- 821 43rd St
- 513 45th St
- 901 39th Ct
- 3808 Broadway
- 3717 Pinewood Ave
- 627 47th St
- 4719 Pinewood Ave
- 809 37th St