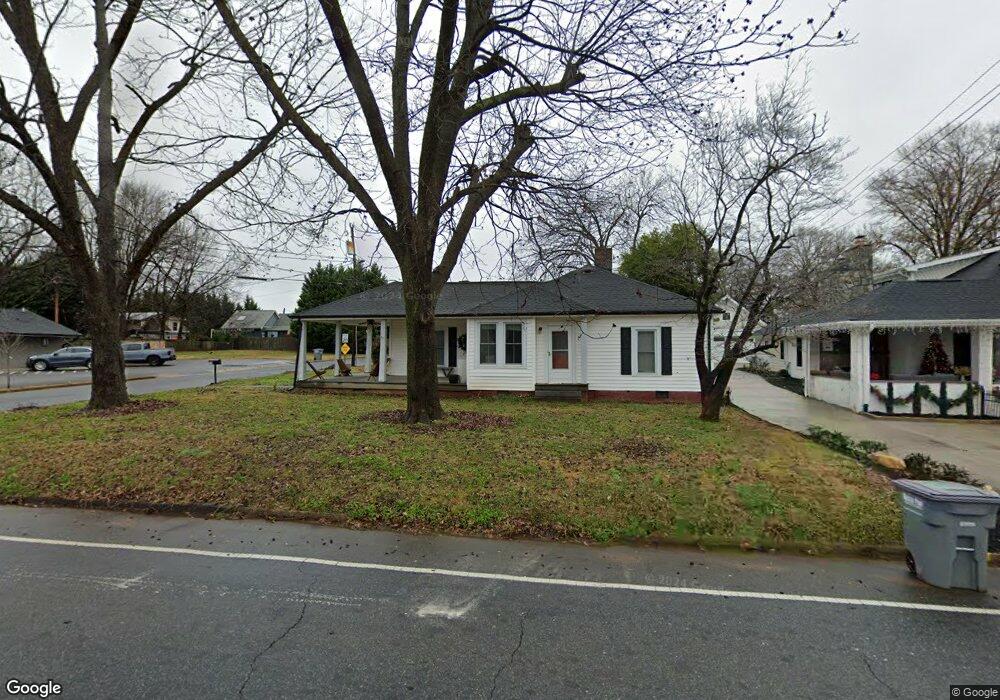
711 Catawba St Belmont, NC 28012
Estimated Value: $341,000 - $356,000
3
Beds
1
Bath
1,326
Sq Ft
$264/Sq Ft
Est. Value
About This Home
This home is located at 711 Catawba St, Belmont, NC 28012 and is currently estimated at $350,187, approximately $264 per square foot. 711 Catawba St is a home located in Gaston County with nearby schools including J B Page Elementary School, Belmont Central Elementary School, and Belmont Middle School.
Ownership History
Date
Name
Owned For
Owner Type
Purchase Details
Closed on
Mar 4, 2022
Sold by
Mitchell Beth H
Bought by
Emard Kathryn
Current Estimated Value
Home Financials for this Owner
Home Financials are based on the most recent Mortgage that was taken out on this home.
Original Mortgage
$322,727
Outstanding Balance
$300,739
Interest Rate
3.69%
Mortgage Type
New Conventional
Estimated Equity
$49,448
Purchase Details
Closed on
Sep 30, 2009
Sold by
Burns Tereasa D
Bought by
Mitchell Beth H
Home Financials for this Owner
Home Financials are based on the most recent Mortgage that was taken out on this home.
Original Mortgage
$126,663
Interest Rate
5.11%
Mortgage Type
FHA
Purchase Details
Closed on
Sep 26, 2007
Sold by
Tucker Ruth and Tucker Bobby Don
Bought by
Burns Tereasa D
Home Financials for this Owner
Home Financials are based on the most recent Mortgage that was taken out on this home.
Original Mortgage
$85,500
Interest Rate
6.57%
Mortgage Type
Purchase Money Mortgage
Create a Home Valuation Report for This Property
The Home Valuation Report is an in-depth analysis detailing your home's value as well as a comparison with similar homes in the area
Home Values in the Area
Average Home Value in this Area
Purchase History
| Date | Buyer | Sale Price | Title Company |
|---|---|---|---|
| Emard Kathryn | $319,500 | Wilson Parks H | |
| Mitchell Beth H | $129,000 | None Available | |
| Burns Tereasa D | $95,000 | None Available |
Source: Public Records
Mortgage History
| Date | Status | Borrower | Loan Amount |
|---|---|---|---|
| Open | Emard Kathryn | $322,727 | |
| Previous Owner | Mitchell Beth H | $126,663 | |
| Previous Owner | Burns Tereasa D | $85,500 |
Source: Public Records
Tax History Compared to Growth
Tax History
| Year | Tax Paid | Tax Assessment Tax Assessment Total Assessment is a certain percentage of the fair market value that is determined by local assessors to be the total taxable value of land and additions on the property. | Land | Improvement |
|---|---|---|---|---|
| 2025 | $3,290 | $312,170 | $55,000 | $257,170 |
| 2024 | $3,290 | $312,170 | $55,000 | $257,170 |
| 2023 | $3,325 | $312,170 | $55,000 | $257,170 |
| 2022 | $1,821 | $139,510 | $22,500 | $117,010 |
| 2021 | $1,876 | $139,510 | $22,500 | $117,010 |
| 2019 | $1,870 | $138,030 | $22,500 | $115,530 |
| 2018 | $1,180 | $85,207 | $14,400 | $70,807 |
| 2017 | $1,146 | $85,207 | $14,400 | $70,807 |
| 2016 | $1,146 | $85,207 | $0 | $0 |
| 2014 | $1,145 | $85,115 | $18,000 | $67,115 |
Source: Public Records
Map
Nearby Homes
- 201 Sloan St
- 206 13th St
- 204 13th St
- 1 Linestowe Dr
- 901 Edgemont Ave
- 405 Linestowe Dr
- 318 6th St
- 70 Volk St
- 302 Planetree Dr
- 5 S 1st St
- 104 Mckee Cir
- 1213 Sandra Ct
- 6828 Wilkinson Blvd
- 5949 Gilchrist Cir
- 201 Browntown Rd
- 116 Saint Giles Ct
- 229 Browntown Rd
- 231 Browntown Rd
- 115 Bryant St
- 4830 Samuel Pinckney Dr
- 711 E Catawba St
- 713 Catawba St
- 709 Catawba St
- 715 Catawba St
- 715 E Catawba St
- 106 Sloan St
- 707 Catawba St
- 717 Catawba St
- 107 Sloan St
- 712 Catawba St Unit B
- 712 Catawba St
- 712 Catawba St Unit A
- 712 E Catawba St Unit B
- 712 E Catawba St
- 708 Catawba St
- 716 Catawba St
- 704 Catawba St
- 703 Catawba St
- 111 Sloan St
- 114 Sloan St