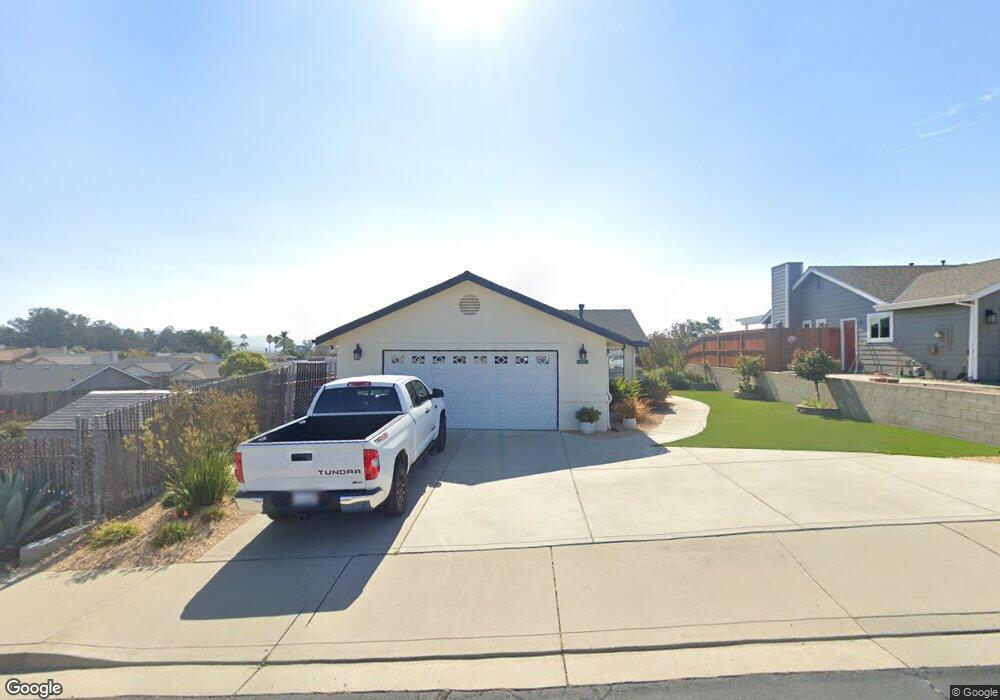
711 Citrus Ln Nipomo, CA 93444
Estimated Value: $757,000 - $835,000
3
Beds
2
Baths
1,700
Sq Ft
$471/Sq Ft
Est. Value
About This Home
This home is located at 711 Citrus Ln, Nipomo, CA 93444 and is currently estimated at $800,283, approximately $470 per square foot. 711 Citrus Ln is a home located in San Luis Obispo County with nearby schools including Dana Elementary School, Mesa Middle School, and Nipomo High School.
Ownership History
Date
Name
Owned For
Owner Type
Purchase Details
Closed on
Oct 23, 2024
Sold by
Sidwell Russell D and Sidwell Cheryl L
Bought by
Russell Sidwell And Cheryl L Sidwell Revocabl and Sidwell
Current Estimated Value
Purchase Details
Closed on
Aug 15, 1996
Sold by
Ackerman Merle J and Zachau Arthur B
Bought by
Sidwell Russell D and Sidwell Cheryl L
Home Financials for this Owner
Home Financials are based on the most recent Mortgage that was taken out on this home.
Original Mortgage
$171,000
Interest Rate
7.88%
Purchase Details
Closed on
Apr 16, 1996
Sold by
Ackerman Merle J and Bell Jack M
Bought by
Ackerman Merle J and Zachau Arthur R
Home Financials for this Owner
Home Financials are based on the most recent Mortgage that was taken out on this home.
Original Mortgage
$133,600
Interest Rate
7.41%
Mortgage Type
Construction
Create a Home Valuation Report for This Property
The Home Valuation Report is an in-depth analysis detailing your home's value as well as a comparison with similar homes in the area
Home Values in the Area
Average Home Value in this Area
Purchase History
| Date | Buyer | Sale Price | Title Company |
|---|---|---|---|
| Russell Sidwell And Cheryl L Sidwell Revocabl | -- | None Listed On Document | |
| Sidwell Russell D | $180,000 | First American Title Ins Co | |
| Ackerman Merle J | $75,000 | First American Title |
Source: Public Records
Mortgage History
| Date | Status | Borrower | Loan Amount |
|---|---|---|---|
| Previous Owner | Sidwell Russell D | $171,000 | |
| Previous Owner | Ackerman Merle J | $133,600 |
Source: Public Records
Tax History Compared to Growth
Tax History
| Year | Tax Paid | Tax Assessment Tax Assessment Total Assessment is a certain percentage of the fair market value that is determined by local assessors to be the total taxable value of land and additions on the property. | Land | Improvement |
|---|---|---|---|---|
| 2025 | $2,942 | $293,128 | $113,991 | $179,137 |
| 2024 | $2,906 | $287,381 | $111,756 | $175,625 |
| 2023 | $2,906 | $281,747 | $109,565 | $172,182 |
| 2022 | $2,861 | $276,223 | $107,417 | $168,806 |
| 2021 | $2,854 | $270,808 | $105,311 | $165,497 |
| 2020 | $2,821 | $268,033 | $104,232 | $163,801 |
| 2019 | $2,802 | $262,779 | $102,189 | $160,590 |
| 2018 | $2,767 | $257,628 | $100,186 | $157,442 |
| 2017 | $2,714 | $252,577 | $98,222 | $154,355 |
| 2016 | $2,558 | $247,626 | $96,297 | $151,329 |
| 2015 | $2,521 | $243,907 | $94,851 | $149,056 |
| 2014 | $2,426 | $239,130 | $92,993 | $146,137 |
Source: Public Records
Map
Nearby Homes
- 483 Violet Ave
- 232 Scarlett Cir
- 522 Higos Way
- 626 Juno Ct
- Mesa Plan at Hill Street Terraces - Hill Street Series
- Pacific Plan at Hill Street Terraces - Hill Street Series
- Monarch Plan at Hill Street Terraces - Hill Street Series
- Rancho Plan at Hill Street Terraces - Hill Street Series
- Dana Plan at Hill Street Terraces - Hill Street Series
- 368 Avenida de Amigos
- 450 Avenida de Socios Unit 12
- 725 Monarch Ln
- 680 Hill St
- 525 Grande Ave Unit D
- 840 Story St
- 719 W Tefft St
- 945 Jeanette Ln
- 426 Polaris Dr
- 759 Viola Ct
- 261 Hazel Ln
- 0 Citrus Ln Unit LOT PI841610
- 0 Citrus Ln Unit LOT3
- 717 Citrus Ln
- 706 January St
- 702 January St
- 712 January St
- 706 Citrus Ln
- 718 January St
- 714 Citrus Ln
- 727 Citrus Ln
- 696 January St
- 724 January St
- 731 Citrus Ln
- 440 Blume St
- 726 Citrus Ln
- 692 January St
- 360 Blume St
- 713 January St
- 728 January St
- 717 January St