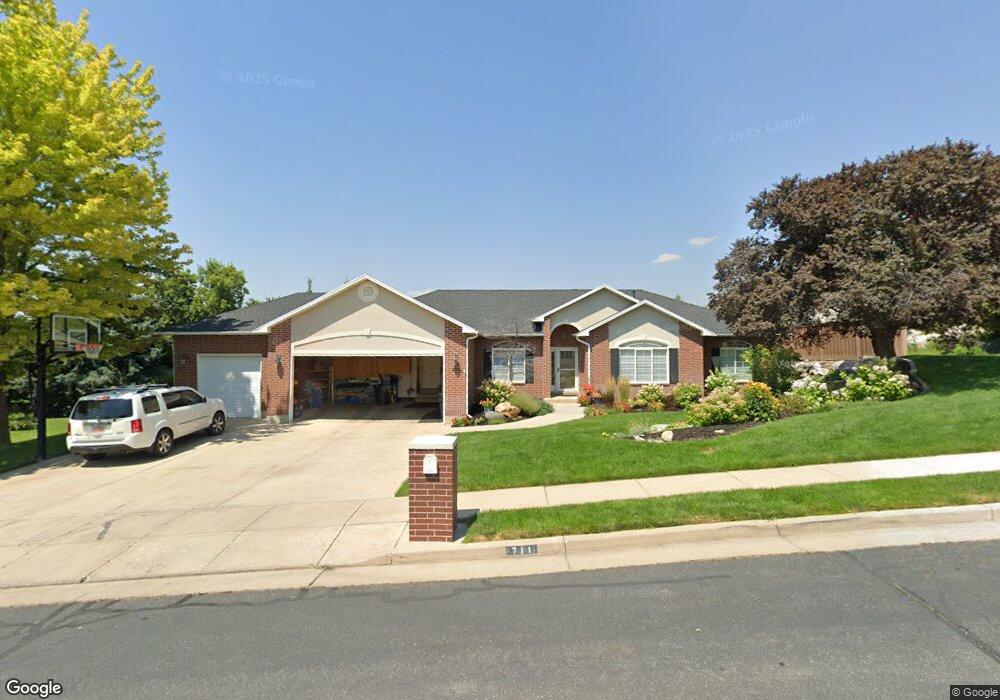
711 E 50 N Providence, UT 84332
Estimated Value: $632,000 - $686,755
Studio
--
Bath
2,047
Sq Ft
$320/Sq Ft
Est. Value
About This Home
This home is located at 711 E 50 N, Providence, UT 84332 and is currently estimated at $655,189, approximately $320 per square foot. 711 E 50 N is a home with nearby schools including Providence School, Spring Creek Middle School, and South Cache Middle School.
Ownership History
Date
Name
Owned For
Owner Type
Purchase Details
Closed on
Dec 19, 2024
Sold by
Johnson Spencer Alan and Johnson Amy F
Bought by
Spencer And Amy Johnson Family Trust and Johnson
Current Estimated Value
Purchase Details
Closed on
Jan 4, 2016
Sold by
Johnson Spencer A and Johnson Amy F
Bought by
Johnson Spencer Alan and Johnnson Amy F
Home Financials for this Owner
Home Financials are based on the most recent Mortgage that was taken out on this home.
Original Mortgage
$95,000
Interest Rate
3.92%
Mortgage Type
Credit Line Revolving
Purchase Details
Closed on
May 26, 2009
Sold by
Johnson Spencer A and Johnson Amy
Bought by
Johnson Spencer A and Johnson Amy F
Create a Home Valuation Report for This Property
The Home Valuation Report is an in-depth analysis detailing your home's value as well as a comparison with similar homes in the area
Home Values in the Area
Average Home Value in this Area
Purchase History
| Date | Buyer | Sale Price | Title Company |
|---|---|---|---|
| Spencer And Amy Johnson Family Trust | -- | None Listed On Document | |
| Spencer And Amy Johnson Family Trust | -- | None Listed On Document | |
| Johnson Spencer Alan | -- | Pinnacle Title | |
| Johnson Spencer A | -- | Pinnacle Title Ins Agency | |
| Johnson Spencer A | -- | Pinnacle Title Ins Agency |
Source: Public Records
Mortgage History
| Date | Status | Borrower | Loan Amount |
|---|---|---|---|
| Previous Owner | Johnson Spencer Alan | $95,000 |
Source: Public Records
Tax History
| Year | Tax Paid | Tax Assessment Tax Assessment Total Assessment is a certain percentage of the fair market value that is determined by local assessors to be the total taxable value of land and additions on the property. | Land | Improvement |
|---|---|---|---|---|
| 2025 | $2,533 | $355,140 | $0 | $0 |
| 2024 | $2,708 | $353,195 | $0 | $0 |
| 2023 | $2,848 | $349,945 | $0 | $0 |
| 2022 | $3,015 | $349,945 | $0 | $0 |
| 2021 | $301 | $534,570 | $127,800 | $406,770 |
| 2020 | $2,661 | $438,864 | $127,800 | $311,064 |
| 2019 | $2,811 | $438,863 | $127,800 | $311,063 |
| 2018 | $2,323 | $370,290 | $99,800 | $270,490 |
| 2017 | $2,253 | $190,135 | $0 | $0 |
| 2016 | $2,278 | $190,135 | $0 | $0 |
| 2015 | $2,111 | $175,805 | $0 | $0 |
| 2014 | $2,060 | $175,805 | $0 | $0 |
| 2013 | -- | $196,355 | $0 | $0 |
Source: Public Records
Map
Nearby Homes
- 615 Foxridge Dr
- 240 Bugle Way
- 118 N Sherwood Dr
- 129 N Sherwood Dr Unit 5
- 196 N 850 E Unit 29
- 585 Maple Hollow Ln
- 602 E 300 N
- 810 E Spring Creek Pkwy
- 840 E Spring Creek Pkwy
- 304 N Sherwood Dr
- 510 Spring Creek Rd
- 215 E 200 N
- 720 E 525 N Unit 32
- 385 N 300 E
- 529 N 470 E
- 151 E 360 N
- 76 E Springs Ln
- 55 Mountain View Cir
- 201 E 580 N
- 188 E 520 N
- 727 E 50 N
- 45 N 700 E
- 712 E 50 N
- 745 E 50 N Unit 14
- 743 E 50 N Unit 15
- 746 E 50 N Unit 10
- 728 E 50 N
- 31 N 700 E
- 751 E 50 N
- 719 Eagleview Dr Unit 21
- 679 Eagle View Ct
- 659 E Center St
- 744 E 50 N
- 15 N 700 E
- 702 N Eagleview Dr
- 763 E 50 N
- 731 E Center St
- 725 Eagle View Dr
- 669 Eagle View Ct
- 767 Eagle View Dr
Your Personal Tour Guide
Ask me questions while you tour the home.