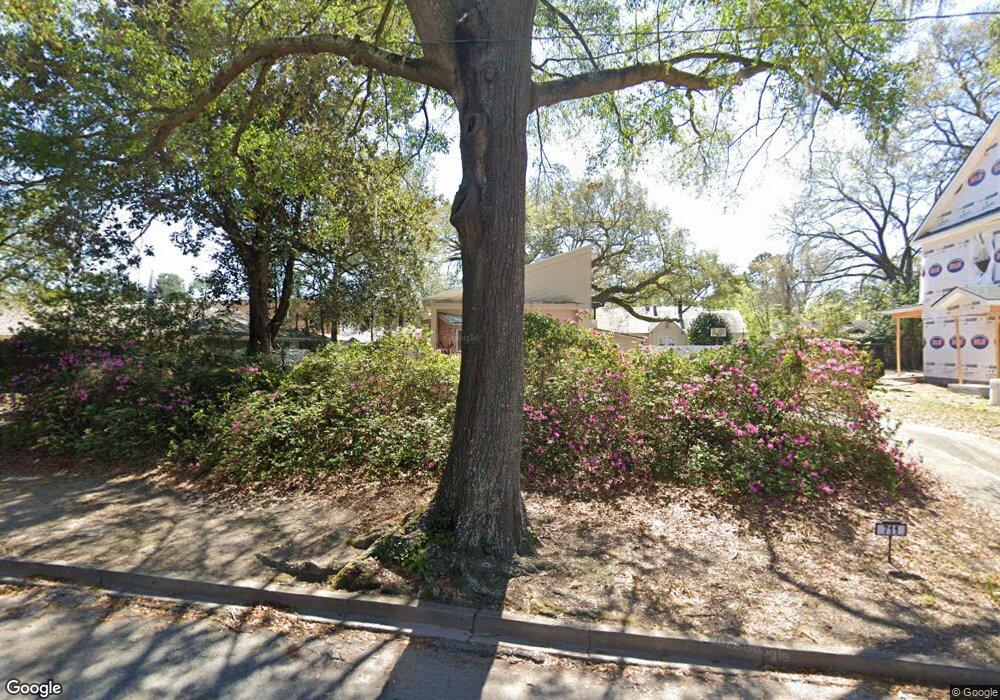
711 E 54th St Savannah, GA 31405
Ardmore-Gould Estates-Olin Heights NeighborhoodEstimated Value: $444,231 - $581,000
3
Beds
2
Baths
2,313
Sq Ft
$221/Sq Ft
Est. Value
About This Home
This home is located at 711 E 54th St, Savannah, GA 31405 and is currently estimated at $512,308, approximately $221 per square foot. 711 E 54th St is a home located in Chatham County with nearby schools including Jacob G. Smith Elementary School, Myers Middle School, and Savannah Arts Academy.
Ownership History
Date
Name
Owned For
Owner Type
Purchase Details
Closed on
Sep 18, 2023
Sold by
Woods Family Revocable Trust
Bought by
Locus 711 Llc
Current Estimated Value
Purchase Details
Closed on
Oct 20, 2011
Sold by
Woods Timothy J
Bought by
Woods Timothy J and Woods Elizabeth R
Purchase Details
Closed on
Apr 13, 2007
Sold by
Not Provided
Bought by
Woods Timothy J and Woods Elizabeth R
Create a Home Valuation Report for This Property
The Home Valuation Report is an in-depth analysis detailing your home's value as well as a comparison with similar homes in the area
Home Values in the Area
Average Home Value in this Area
Purchase History
| Date | Buyer | Sale Price | Title Company |
|---|---|---|---|
| Locus 711 Llc | -- | -- | |
| Woods Timothy J | -- | -- | |
| Woods Timothy J | -- | -- | |
| Woods Timothy J | $148,000 | -- |
Source: Public Records
Tax History
| Year | Tax Paid | Tax Assessment Tax Assessment Total Assessment is a certain percentage of the fair market value that is determined by local assessors to be the total taxable value of land and additions on the property. | Land | Improvement |
|---|---|---|---|---|
| 2025 | $3,800 | $131,440 | $30,000 | $101,440 |
| 2024 | $38 | $131,440 | $30,000 | $101,440 |
| 2023 | $1,363 | $131,440 | $30,000 | $101,440 |
| 2022 | $3,134 | $121,280 | $30,000 | $91,280 |
| 2021 | $4,405 | $101,680 | $20,000 | $81,680 |
| 2020 | $3,218 | $100,800 | $20,000 | $80,800 |
| 2019 | $4,528 | $101,920 | $26,440 | $75,480 |
| 2018 | $3,218 | $101,920 | $26,440 | $75,480 |
| 2017 | $2,989 | $119,560 | $26,440 | $93,120 |
| 2016 | $2,073 | $71,040 | $26,440 | $44,600 |
| 2015 | $1,481 | $55,400 | $26,440 | $28,960 |
| 2014 | $3,197 | $57,640 | $0 | $0 |
Source: Public Records
Map
Nearby Homes
Your Personal Tour Guide
Ask me questions while you tour the home.