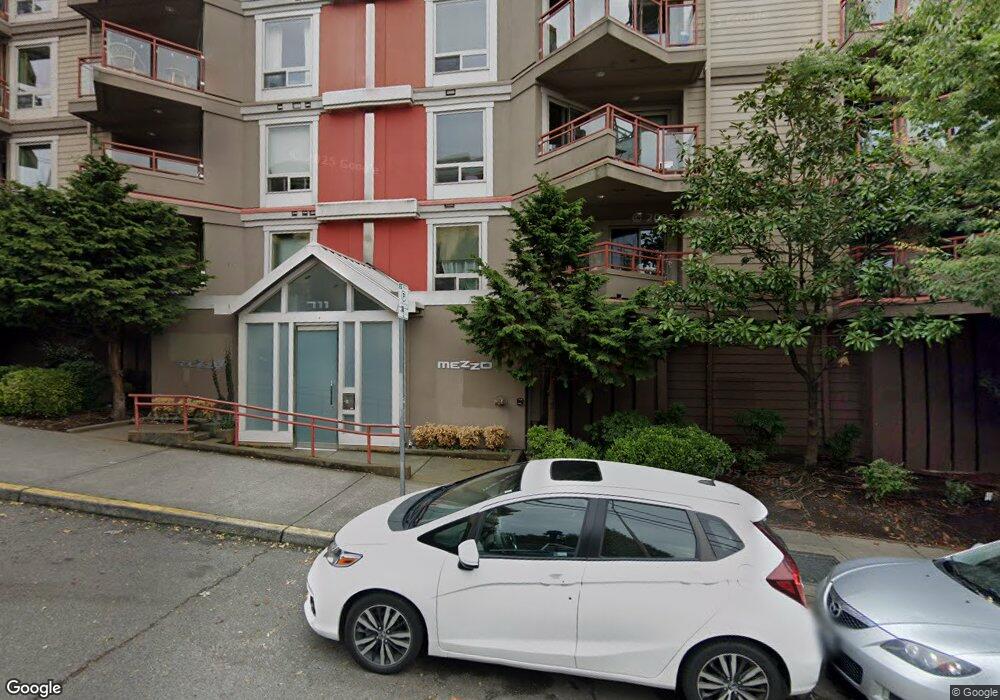
711 E Denny Way Unit 406 Seattle, WA 98122
Capitol Hill NeighborhoodEstimated Value: $396,000 - $455,897
1
Bed
2
Baths
663
Sq Ft
$637/Sq Ft
Est. Value
About This Home
This home is located at 711 E Denny Way Unit 406, Seattle, WA 98122 and is currently estimated at $422,474, approximately $637 per square foot. 711 E Denny Way Unit 406 is a home located in King County with nearby schools including Lowell Elementary School, Meany Middle School, and Garfield High School.
Ownership History
Date
Name
Owned For
Owner Type
Purchase Details
Closed on
Dec 21, 2012
Sold by
Sigmund Barrett R
Bought by
Sigmund Barrett R and Macomber Brooke M
Current Estimated Value
Home Financials for this Owner
Home Financials are based on the most recent Mortgage that was taken out on this home.
Original Mortgage
$293,200
Outstanding Balance
$202,181
Interest Rate
3.27%
Mortgage Type
New Conventional
Estimated Equity
$220,293
Purchase Details
Closed on
Aug 10, 2006
Sold by
711 E Denny Llc
Bought by
Sigmund Barrett R
Home Financials for this Owner
Home Financials are based on the most recent Mortgage that was taken out on this home.
Original Mortgage
$295,000
Interest Rate
6.12%
Mortgage Type
Purchase Money Mortgage
Create a Home Valuation Report for This Property
The Home Valuation Report is an in-depth analysis detailing your home's value as well as a comparison with similar homes in the area
Home Values in the Area
Average Home Value in this Area
Purchase History
| Date | Buyer | Sale Price | Title Company |
|---|---|---|---|
| Sigmund Barrett R | -- | First American | |
| Sigmund Barrett R | $395,000 | Fidelity Natio |
Source: Public Records
Mortgage History
| Date | Status | Borrower | Loan Amount |
|---|---|---|---|
| Open | Sigmund Barrett R | $293,200 | |
| Closed | Sigmund Barrett R | $295,000 |
Source: Public Records
Tax History Compared to Growth
Tax History
| Year | Tax Paid | Tax Assessment Tax Assessment Total Assessment is a certain percentage of the fair market value that is determined by local assessors to be the total taxable value of land and additions on the property. | Land | Improvement |
|---|---|---|---|---|
| 2024 | $4,201 | $444,000 | $194,100 | $249,900 |
| 2023 | $3,921 | $495,000 | $194,100 | $300,900 |
| 2022 | $4,488 | $470,000 | $194,100 | $275,900 |
| 2021 | $4,349 | $497,000 | $194,100 | $302,900 |
| 2020 | $4,943 | $457,000 | $194,100 | $262,900 |
| 2018 | $4,186 | $531,000 | $167,400 | $363,600 |
| 2017 | $3,482 | $430,000 | $174,700 | $255,300 |
| 2016 | $3,346 | $369,000 | $63,100 | $305,900 |
| 2015 | $3,166 | $346,000 | $63,100 | $282,900 |
| 2014 | -- | $335,000 | $63,100 | $271,900 |
| 2013 | -- | $275,000 | $60,600 | $214,400 |
Source: Public Records
Map
Nearby Homes
- 711 E Denny Way Unit 104
- 717 E Denny Way Unit 1A
- 605 E Denny Way
- 700 E Denny Way Unit PH3
- 1711 E Olive Way Unit S311
- 505 E Denny Way Unit A304
- 505 E Denny Way Unit A106
- 505 E Denny Way Unit A506
- 1712 Belmont Ave
- 1718 Summit Ave
- 219 Belmont Ave E
- 1620 Belmont Ave Unit 226
- 1620 Belmont Ave Unit 529
- 221 Belmont Ave E
- 231 Belmont Ave E Unit 310
- 231 Belmont Ave E Unit 106
- 211 Summit Ave E Unit N108
- 1616 Summit Ave Unit 203
- 1610 Belmont Ave Unit 407
- 1610 Belmont Ave Unit 306
- 711 E Denny Way Unit 107
- 711 E Denny Way Unit 103
- 711 E Denny Way Unit 402
- 711 E Denny Way Unit 106
- 711 E Denny Way Unit 101
- 711 E Denny Way Unit 203
- 711 E Denny Way Unit 306
- 711 E Denny Way Unit 207
- 711 E Denny Way Unit 201
- 711 E Denny Way Unit 102
- 711 E Denny Way Unit 304
- 711 E Denny Way Unit 105
- 711 E Denny Way Unit 301
- 711 E Denny Way Unit 202
- 711 E Denny Way Unit 206
- 711 E Denny Way Unit 305
- 711 E Denny Way Unit 205
- 711 E Denny Way Unit 307
- 711 E Denny Way Unit 403