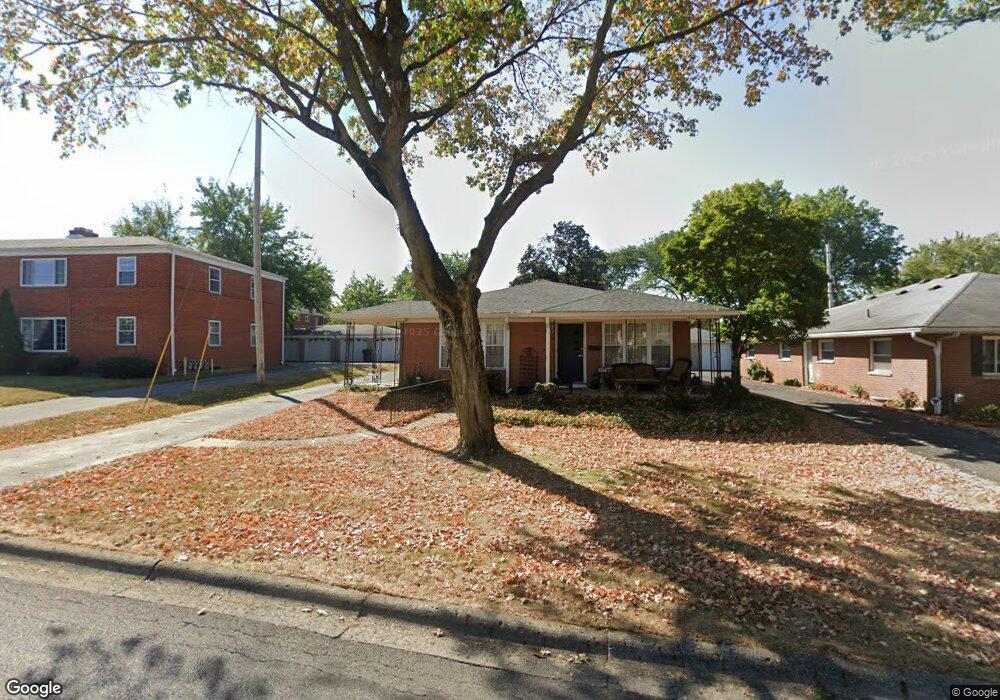
711 E Schreyer Place Unit 713 Columbus, OH 43214
Clintonville NeighborhoodEstimated Value: $295,000 - $458,454
4
Beds
2
Baths
1,848
Sq Ft
$195/Sq Ft
Est. Value
About This Home
This home is located at 711 E Schreyer Place Unit 713, Columbus, OH 43214 and is currently estimated at $360,364, approximately $195 per square foot. 711 E Schreyer Place Unit 713 is a home located in Franklin County with nearby schools including Colerain Elementary School, Dominion Middle School, and Whetstone High School.
Ownership History
Date
Name
Owned For
Owner Type
Purchase Details
Closed on
Apr 15, 2011
Sold by
Vargo Marcia J and Vargo Louise J
Bought by
Dawes Kelly A
Current Estimated Value
Home Financials for this Owner
Home Financials are based on the most recent Mortgage that was taken out on this home.
Original Mortgage
$134,400
Outstanding Balance
$7,285
Interest Rate
4.93%
Mortgage Type
New Conventional
Estimated Equity
$353,079
Purchase Details
Closed on
Apr 13, 2011
Sold by
Hargreaves William T and Hargreaves Joyce Anne
Bought by
Dawes Kelly A
Home Financials for this Owner
Home Financials are based on the most recent Mortgage that was taken out on this home.
Original Mortgage
$134,400
Outstanding Balance
$7,285
Interest Rate
4.93%
Mortgage Type
New Conventional
Estimated Equity
$353,079
Purchase Details
Closed on
Nov 20, 1980
Bought by
Sabino Helen M
Create a Home Valuation Report for This Property
The Home Valuation Report is an in-depth analysis detailing your home's value as well as a comparison with similar homes in the area
Home Values in the Area
Average Home Value in this Area
Purchase History
| Date | Buyer | Sale Price | Title Company |
|---|---|---|---|
| Dawes Kelly A | $96,000 | Northwest T | |
| Dawes Kelly A | $96,000 | Northwest T | |
| Sabino Helen M | -- | -- |
Source: Public Records
Mortgage History
| Date | Status | Borrower | Loan Amount |
|---|---|---|---|
| Open | Dawes Kelly A | $134,400 |
Source: Public Records
Tax History Compared to Growth
Tax History
| Year | Tax Paid | Tax Assessment Tax Assessment Total Assessment is a certain percentage of the fair market value that is determined by local assessors to be the total taxable value of land and additions on the property. | Land | Improvement |
|---|---|---|---|---|
| 2024 | $5,539 | $120,860 | $36,440 | $84,420 |
| 2023 | $5,470 | $120,855 | $36,435 | $84,420 |
| 2022 | $5,099 | $95,940 | $30,630 | $65,310 |
| 2021 | $5,108 | $95,940 | $30,630 | $65,310 |
| 2020 | $5,115 | $95,940 | $30,630 | $65,310 |
| 2019 | $4,590 | $73,820 | $23,560 | $50,260 |
| 2018 | $2,291 | $73,820 | $23,560 | $50,260 |
| 2017 | $4,589 | $73,820 | $23,560 | $50,260 |
| 2016 | $4,794 | $70,560 | $18,970 | $51,590 |
| 2015 | $2,182 | $70,560 | $18,970 | $51,590 |
| 2014 | $4,375 | $70,560 | $18,970 | $51,590 |
| 2013 | $2,055 | $67,200 | $18,060 | $49,140 |
Source: Public Records
Map
Nearby Homes
- 4193 Eastlea Dr
- 4266 Fairoaks Dr
- 814 Meadowview Dr
- 4299 Colerain Ave
- 4000 Indianola Ave
- 685 Yaronia Dr N
- 4508 Glenmawr Ave
- 411 Garden Rd
- 1064 Hillsdale Dr
- 522 E Beechwold Blvd
- 340 Canyon Dr S
- 3938 Eisenhower Rd
- 958 Janet Dr
- 518 E Royal Forest Blvd
- 541 Northridge Rd
- 1130 Carbone Dr
- 601 Morse Rd
- 4441 Wetmore Rd E
- 197 E Cooke Rd
- 1071 Loring Rd
- 703 E Schreyer Place Unit 705
- 703-705 E Schreyer Place
- 695 E Schreyer Place Unit 697
- 712 Springs Dr Unit 716
- 4267 Indianola Ave
- 706 Springs Dr Unit 708
- 706 Springs Dr Unit 2
- 698 Springs Dr Unit 700
- 687-689 E Schreyer Place
- 687 E Schreyer Place Unit 689
- 704 E Schreyer Place
- 690 Springs Dr Unit 692
- 4303 Indianola Ave
- 4298 Eastlea Dr Unit 300
- 688 E Schreyer Place
- 4278 Indianola Ave
- 4292 Indianola Ave
- 4290 Indianola Ave
- 680 E Schreyer Place
- 705 Springs Dr Unit 707