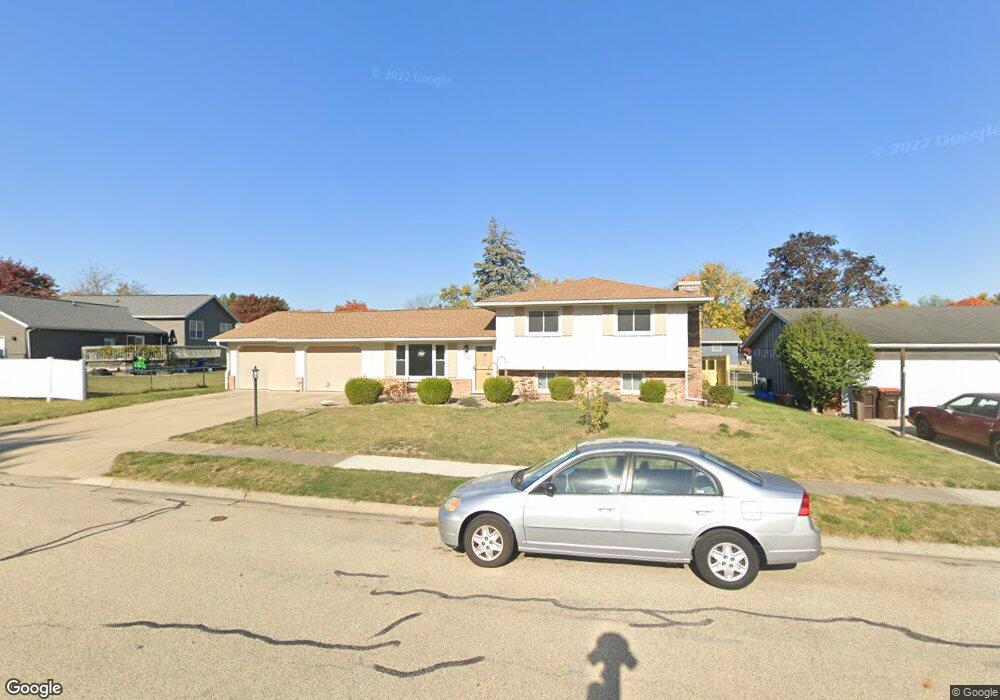
711 Fillmore St Morton, IL 61550
Estimated Value: $281,000 - $354,000
About This Home
This home is located at 711 Fillmore St, Morton, IL 61550 and is currently estimated at $307,971, approximately $125 per square foot. 711 Fillmore St is a home located in Tazewell County with nearby schools including Morton High School, Blessed Sacrament School, and Bethel Lutheran School.
Ownership History
We collect this data history from publicly available records. To have your information removed, we recommend requesting removal directly through your county’s website.
Purchase Details
Home Financials for this Owner
Home Financials are based on the most recent Mortgage that was taken out on this home.Home Values in the Area
Average Home Value in this Area
Purchase History
We collect this data history from publicly available records. To have your information removed, we recommend requesting removal directly through your county’s website.
| Date | Buyer | Sale Price | Title Company |
|---|---|---|---|
| $184,000 | None Available |
Mortgage History
We collect this data history from publicly available records. To have your information removed, we recommend requesting removal directly through your county’s website.
| Date | Status | Borrower | Loan Amount |
|---|---|---|---|
| Open | $18,216 | ||
| Open | $147,200 |
Tax History
We collect this data history from publicly available records. To have your information removed, we recommend requesting removal directly through your county’s website.
| Year | Tax Paid | Tax Assessment Tax Assessment Total Assessment is a certain percentage of the fair market value that is determined by local assessors to be the total taxable value of land and additions on the property. | Land | Improvement |
|---|---|---|---|---|
| 2025 | -- | $87,570 | $13,570 | $74,000 |
| 2024 | $5,141 | $81,690 | $12,660 | $69,030 |
| 2023 | $5,141 | $76,100 | $11,790 | $64,310 |
| 2022 | $4,934 | $69,890 | $10,830 | $59,060 |
| 2021 | $4,728 | $67,200 | $10,410 | $56,790 |
| 2020 | $4,579 | $66,540 | $10,310 | $56,230 |
| 2019 | $4,567 | $66,540 | $10,310 | $56,230 |
| 2018 | $4,483 | $66,540 | $10,310 | $56,230 |
| 2017 | $4,367 | $65,880 | $10,210 | $55,670 |
| 2016 | $4,279 | $63,450 | $9,830 | $53,620 |
| 2015 | $4,115 | $0 | $0 | $0 |
| 2013 | $4,073 | $63,450 | $9,830 | $53,620 |
Map
- 501-503 Pierce St
- 624 N Nebraska Ave
- 1044 E Polk St
- 535 N Oklahoma Ave
- 401 N Ohio Ave
- 540 N Main St
- 119 E Van Buren St
- 929 E Monroe St
- 324 York Ave
- 249 N Illinois Ave
- 1020 E Madison St
- 129 N Louisiana Ave
- 211 W Pershing St
- 133 N Indiana Ave
- 407 E Jefferson St
- 66 Warwick Cir
- 420 Brentwood Rd Unit 105
- 646 S 4th Ave Unit 18
- 346 S Nebraska Ave
- 470 E Fernwood St
- 730 Pierce St
- 740 Pierce St
- 720 Pierce St
- 721 Fillmore St
- 731 Fillmore St
- 750 Pierce St
- 710 Pierce St
- 741 Fillmore St
- 731 Pierce St
- 741 Pierce St
- 721 Pierce St
- 760 Pierce St
- 750 N Nebraska Ave
- 751 Pierce St
- 760 N Nebraska Ave
- 760 N Nebraska Ave Unit 3
- 711 Pierce St
- 724 Fillmore St
- 730 Fillmore St
- 712 Fillmore St
Ask me questions while you tour the home.