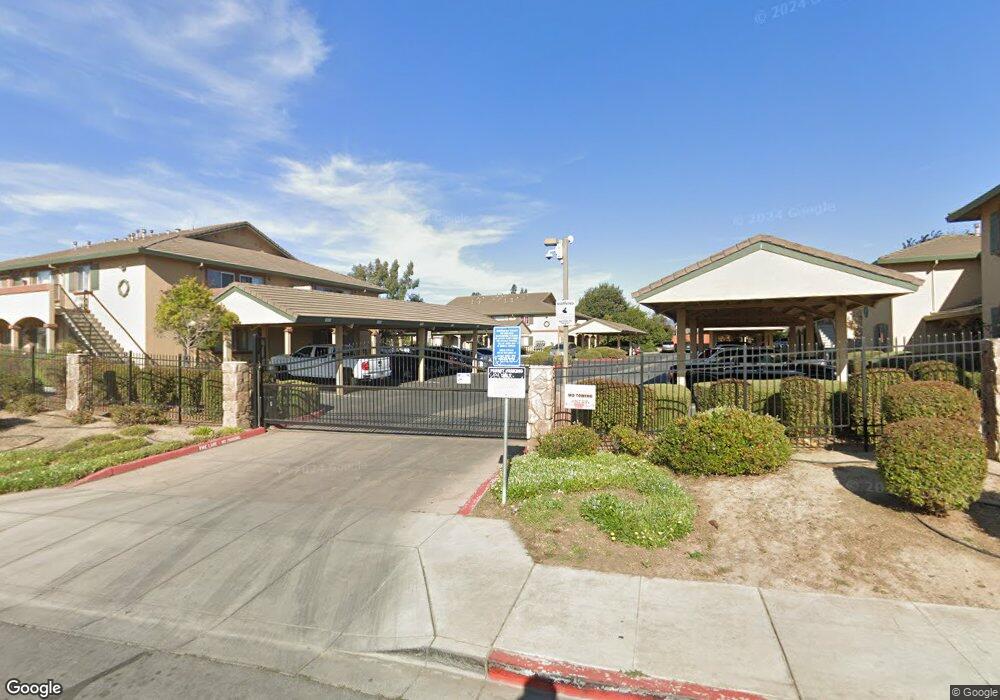
711 Garner Ave Unit 204 Salinas, CA 93905
East Salinas NeighborhoodEstimated Value: $344,000 - $377,000
3
Beds
1
Bath
988
Sq Ft
$368/Sq Ft
Est. Value
About This Home
This home is located at 711 Garner Ave Unit 204, Salinas, CA 93905 and is currently estimated at $363,509, approximately $367 per square foot. 711 Garner Ave Unit 204 is a home located in Monterey County with nearby schools including Virginia Rocca Barton Elementary School, La Paz Middle School, and Alisal High School.
Ownership History
Date
Name
Owned For
Owner Type
Purchase Details
Closed on
Apr 20, 2009
Sold by
Us Bank National Association Nd
Bought by
Johnson Karen
Current Estimated Value
Home Financials for this Owner
Home Financials are based on the most recent Mortgage that was taken out on this home.
Original Mortgage
$42,000
Outstanding Balance
$26,665
Interest Rate
5.02%
Mortgage Type
Unknown
Estimated Equity
$336,844
Purchase Details
Closed on
Dec 1, 2008
Sold by
Cabutage Tom
Bought by
Us Bank National Association Nd
Purchase Details
Closed on
Jun 18, 2004
Sold by
Cabutage Leticia A
Bought by
Cabutage Tom
Home Financials for this Owner
Home Financials are based on the most recent Mortgage that was taken out on this home.
Original Mortgage
$234,900
Interest Rate
6.09%
Mortgage Type
Credit Line Revolving
Create a Home Valuation Report for This Property
The Home Valuation Report is an in-depth analysis detailing your home's value as well as a comparison with similar homes in the area
Home Values in the Area
Average Home Value in this Area
Purchase History
| Date | Buyer | Sale Price | Title Company |
|---|---|---|---|
| Johnson Karen | $52,500 | North American Title Company | |
| Us Bank National Association Nd | $149,250 | Accommodation | |
| Cabutage Tom | -- | Chicago Title | |
| Cabutage Tom | $235,000 | Chicago Title |
Source: Public Records
Mortgage History
| Date | Status | Borrower | Loan Amount |
|---|---|---|---|
| Open | Johnson Karen | $42,000 | |
| Previous Owner | Cabutage Tom | $234,900 |
Source: Public Records
Tax History
| Year | Tax Paid | Tax Assessment Tax Assessment Total Assessment is a certain percentage of the fair market value that is determined by local assessors to be the total taxable value of land and additions on the property. | Land | Improvement |
|---|---|---|---|---|
| 2025 | $1,391 | $103,002 | $38,623 | $64,379 |
| 2024 | $1,391 | $100,983 | $37,866 | $63,117 |
| 2023 | $1,365 | $99,004 | $37,124 | $61,880 |
| 2022 | $1,230 | $97,064 | $36,397 | $60,667 |
| 2021 | $1,142 | $95,162 | $35,684 | $59,478 |
| 2020 | $1,129 | $94,188 | $35,319 | $58,869 |
| 2019 | $1,161 | $92,342 | $34,627 | $57,715 |
| 2018 | $1,091 | $90,533 | $33,949 | $56,584 |
| 2017 | $1,130 | $88,759 | $33,284 | $55,475 |
| 2016 | $1,071 | $87,020 | $32,632 | $54,388 |
| 2015 | $1,061 | $85,714 | $32,142 | $53,572 |
| 2014 | $1,022 | $84,036 | $31,513 | $52,523 |
Source: Public Records
Map
Nearby Homes
- 948 Rider Ave
- 755 Pino Way
- 1049 Twin Creeks Dr
- 1094 Twin Creeks Dr
- 933 Acosta Plaza Unit 35
- 11 Manzano Cir
- 11 E Laurel Dr
- 1046 C St
- 609 Saint George Dr
- 11 Hill Cir
- 544 Saint George Dr
- 1725 Great Island St
- 724 Circle Dr
- 1671 Cambrian Dr
- 1527 Atherton Way
- 320 N Sanborn Rd
- 1544 Saguaro Dr Unit 4
- 11 Saguaro Cir
- 15 Cheswick Cir
- 10 Rex Cir
- 711 Garner Ave Unit 101
- 711 Garner Ave Unit 201
- 711 Garner Ave Unit 203
- 711 Garner Ave Unit 104
- 711 Garner Ave Unit 102
- 711 Garner Ave Unit 101
- 711 Garner Ave Unit 103
- 711 Garner Ave Unit 202
- 705 Garner Ave Unit 101
- 705 Garner Ave Unit 102
- 705 Garner Ave Unit 203
- 705 Garner Ave Unit 201
- 705 Garner Ave Unit 104
- 705 Garner Ave Unit 103
- 705 Garner Ave Unit 204
- 705 Garner Ave Unit 202
- 705 Garner Ave Unit 101
- 709 Garner Ave Unit 101
- 709 Garner Ave Unit 202
- 709 Garner Ave Unit 102
Your Personal Tour Guide
Ask me questions while you tour the home.