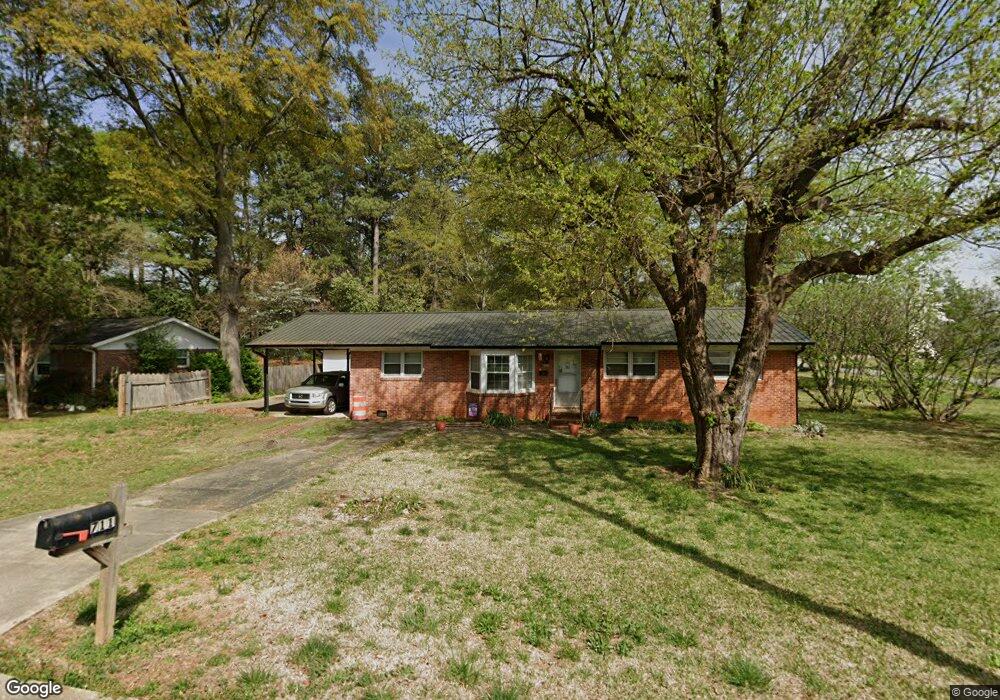
711 Inglewood Dr SE Smyrna, GA 30080
Estimated Value: $281,000 - $331,583
3
Beds
2
Baths
1,037
Sq Ft
$300/Sq Ft
Est. Value
About This Home
This home is located at 711 Inglewood Dr SE, Smyrna, GA 30080 and is currently estimated at $310,896, approximately $299 per square foot. 711 Inglewood Dr SE is a home located in Cobb County with nearby schools including Belmont Hills Elementary School, Campbell High School, and International Academy of Smyrna.
Ownership History
Date
Name
Owned For
Owner Type
Purchase Details
Closed on
Sep 20, 2007
Sold by
Spivey Jay A and Spivey Frennis M
Bought by
Porter Charleston
Current Estimated Value
Home Financials for this Owner
Home Financials are based on the most recent Mortgage that was taken out on this home.
Original Mortgage
$132,356
Outstanding Balance
$83,070
Interest Rate
6.49%
Mortgage Type
FHA
Estimated Equity
$227,826
Create a Home Valuation Report for This Property
The Home Valuation Report is an in-depth analysis detailing your home's value as well as a comparison with similar homes in the area
Home Values in the Area
Average Home Value in this Area
Purchase History
| Date | Buyer | Sale Price | Title Company |
|---|---|---|---|
| Porter Charleston | $134,500 | -- |
Source: Public Records
Mortgage History
| Date | Status | Borrower | Loan Amount |
|---|---|---|---|
| Open | Porter Charleston | $132,356 |
Source: Public Records
Tax History Compared to Growth
Tax History
| Year | Tax Paid | Tax Assessment Tax Assessment Total Assessment is a certain percentage of the fair market value that is determined by local assessors to be the total taxable value of land and additions on the property. | Land | Improvement |
|---|---|---|---|---|
| 2025 | $3,610 | $132,920 | $40,000 | $92,920 |
| 2024 | $3,879 | $142,816 | $40,000 | $102,816 |
| 2023 | $2,881 | $106,060 | $22,000 | $84,060 |
| 2022 | $2,035 | $74,388 | $20,000 | $54,388 |
| 2021 | $2,045 | $74,388 | $20,000 | $54,388 |
| 2020 | $1,755 | $63,852 | $20,000 | $43,852 |
| 2019 | $1,755 | $63,852 | $20,000 | $43,852 |
| 2018 | $1,422 | $51,736 | $15,200 | $36,536 |
| 2017 | $1,177 | $45,620 | $18,000 | $27,620 |
| 2016 | $812 | $31,480 | $8,000 | $23,480 |
| 2015 | $810 | $30,680 | $7,200 | $23,480 |
| 2014 | $618 | $23,172 | $0 | $0 |
Source: Public Records
Map
Nearby Homes
- 733 San Fernando Dr SE
- 675 Inglewood Dr SE
- 2370 Beaver Creek Rd SE Unit 4
- 619 Inglewood Dr SE
- 690 Green Acres Rd SE
- 2145 Valley Oaks Dr SE
- 2491 Pasadena Place SE
- 2275 Old Spring Rd SE
- 2510 Glendale Cir SE
- 2305 Ventura Rd SE
- 2185 Trailwood Dr SE
- 846 Mell Ct SE
- 2178 Elizabeth Ave SE
- 2618 Birch St SE
- 839 Wayland Ct SE
- 2046 Harold Ave SE
- 235 Still Pine Bend
- 764 San Fernando Dr SE
- 702 Burbank Dr SE
- 697 Inglewood Dr SE Unit 3
- 696 Burbank Dr SE Unit 3
- 754 San Fernando Dr SE
- 758 San Fernando Dr SE Unit 3
- 700 Inglewood Dr SE Unit 3
- 748 San Fernando Dr SE
- 770 San Fernando Dr SE
- 686 Burbank Dr SE Unit III
- 694 Inglewood Dr SE Unit 25
- 694 Inglewood Dr SE
- 675 Burbank Dr SE
- 691 Inglewood Dr SE
- 763 San Fernando Dr SE
- 763 San Fernando Dr SE Unit 3
- 771 San Fernando Dr SE
- 676 Burbank Dr SE
- 742 San Fernando Dr SE Unit 3
- 759 San Fernando Dr SE