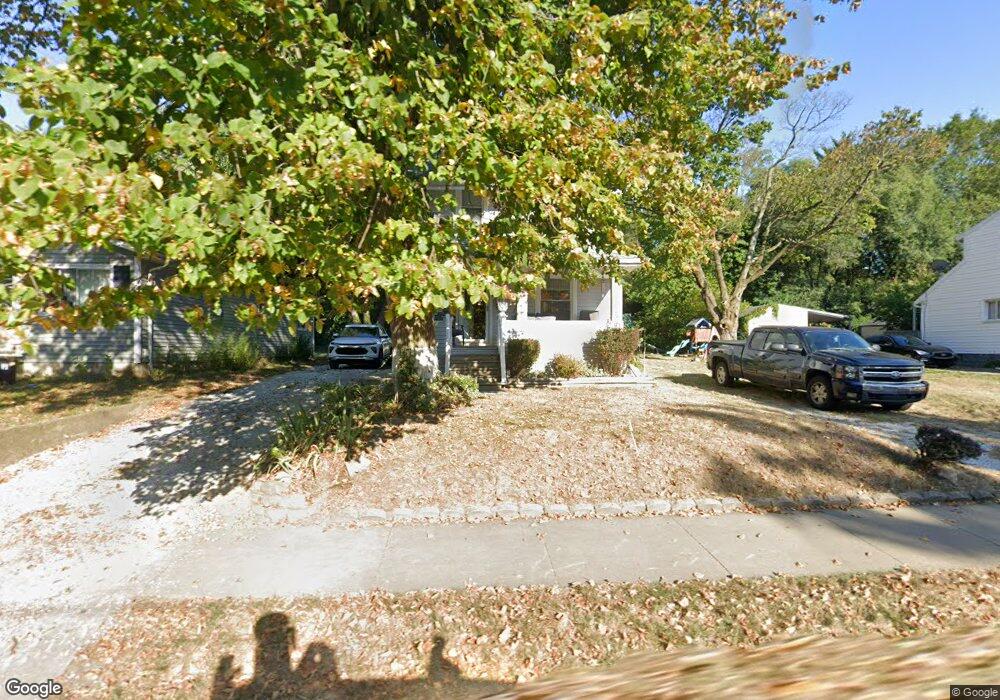
711 Inman St Akron, OH 44306
East Akron NeighborhoodEstimated Value: $69,808 - $101,000
3
Beds
1
Bath
960
Sq Ft
$92/Sq Ft
Est. Value
About This Home
This home is located at 711 Inman St, Akron, OH 44306 and is currently estimated at $88,452, approximately $92 per square foot. 711 Inman St is a home located in Summit County with nearby schools including Glover Community Learning Center, Kenmore Garfield Community Learning Center, and Main Preparatory Academy.
Ownership History
Date
Name
Owned For
Owner Type
Purchase Details
Closed on
Oct 12, 2004
Sold by
Banks Alicia R and Banks Ernest J
Bought by
Banks Alicia R
Current Estimated Value
Purchase Details
Closed on
Dec 1, 1999
Sold by
Lee William E and Rafferty John C
Bought by
Banks Alicia R
Home Financials for this Owner
Home Financials are based on the most recent Mortgage that was taken out on this home.
Original Mortgage
$50,400
Interest Rate
7.97%
Mortgage Type
Balloon
Create a Home Valuation Report for This Property
The Home Valuation Report is an in-depth analysis detailing your home's value as well as a comparison with similar homes in the area
Home Values in the Area
Average Home Value in this Area
Purchase History
| Date | Buyer | Sale Price | Title Company |
|---|---|---|---|
| Banks Alicia R | -- | -- | |
| Banks Alicia R | $63,000 | Brooklyn Title Agency Inc |
Source: Public Records
Mortgage History
| Date | Status | Borrower | Loan Amount |
|---|---|---|---|
| Closed | Banks Alicia R | $50,400 |
Source: Public Records
Tax History Compared to Growth
Tax History
| Year | Tax Paid | Tax Assessment Tax Assessment Total Assessment is a certain percentage of the fair market value that is determined by local assessors to be the total taxable value of land and additions on the property. | Land | Improvement |
|---|---|---|---|---|
| 2025 | $355 | $16,038 | $3,917 | $12,121 |
| 2024 | $355 | $16,038 | $3,917 | $12,121 |
| 2023 | $355 | $16,038 | $3,917 | $12,121 |
| 2022 | $130 | $9,580 | $2,303 | $7,277 |
| 2021 | $130 | $9,580 | $2,303 | $7,277 |
| 2020 | $130 | $9,580 | $2,300 | $7,280 |
| 2019 | $175 | $10,140 | $3,250 | $6,890 |
| 2018 | $174 | $10,140 | $3,250 | $6,890 |
| 2017 | $364 | $10,140 | $3,250 | $6,890 |
| 2016 | $364 | $12,240 | $3,890 | $8,350 |
| 2015 | $364 | $12,240 | $3,890 | $8,350 |
| 2014 | $362 | $12,240 | $3,890 | $8,350 |
| 2013 | $404 | $12,930 | $3,890 | $9,040 |
Source: Public Records
Map
Nearby Homes
- 696 Inman St
- 836 5th Ave
- 720 E Crosier St
- 939 E Crosier St
- 522 Winans Ave
- 548 Winans Ave
- 823 Merton Ave
- 495 Elbon Ave
- 920 Rowe St
- 694 Virginia Ave
- 622 Talbot Ave
- 877 Bertha Ave
- 426 S Arlington St
- 352 Talbot Ave
- 970 Allendale Ave
- 713 Virginia Ave
- 724 Virginia Ave
- 546 Baird St
- 717 Virginia Ave
- 542 Baird St