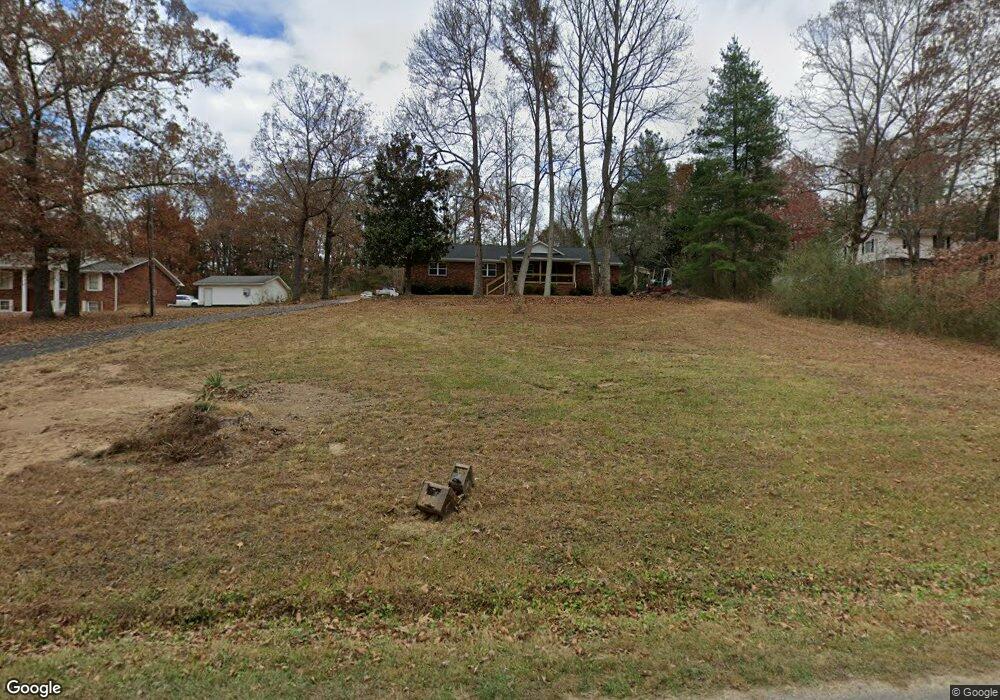
711 John Burch Rd Dunlap, TN 37327
Estimated Value: $321,000 - $426,201
Studio
2
Baths
1,632
Sq Ft
$222/Sq Ft
Est. Value
About This Home
This home is located at 711 John Burch Rd, Dunlap, TN 37327 and is currently estimated at $361,800, approximately $221 per square foot. 711 John Burch Rd is a home located in Sequatchie County with nearby schools including Griffith Elementary School, Sequatchie County Middle School, and Sequatchie County High School.
Ownership History
Date
Name
Owned For
Owner Type
Purchase Details
Closed on
Jan 5, 2024
Sold by
Morrow Jared
Bought by
Stephenson Ryan Casey and Stephenson Megan E
Current Estimated Value
Home Financials for this Owner
Home Financials are based on the most recent Mortgage that was taken out on this home.
Original Mortgage
$374,900
Outstanding Balance
$362,591
Interest Rate
4%
Mortgage Type
VA
Estimated Equity
-$791
Purchase Details
Closed on
May 9, 2023
Sold by
Vargas Jose R and Vargas Laura I
Bought by
Morrow Jared
Purchase Details
Closed on
Nov 9, 2022
Sold by
Martin Anna Mae
Bought by
Vargas Jose R and Velasquez Laura I
Create a Home Valuation Report for This Property
The Home Valuation Report is an in-depth analysis detailing your home's value as well as a comparison with similar homes in the area
Home Values in the Area
Average Home Value in this Area
Purchase History
We collect this data history from publicly available records. To have your information removed, we recommend requesting removal directly through your county’s website.
| Date | Buyer | Sale Price | Title Company |
|---|---|---|---|
| Stephenson Ryan Casey | $374,900 | None Listed On Document | |
| Morrow Jared | $52,000 | None Listed On Document | |
| Vargas Jose R | -- | -- | |
| Vargas Jose R | -- | None Listed On Document |
Source: Public Records
Mortgage History
We collect this data history from publicly available records. To have your information removed, we recommend requesting removal directly through your county’s website.
| Date | Status | Borrower | Loan Amount |
|---|---|---|---|
| Open | Stephenson Ryan Casey | $374,900 |
Source: Public Records
Tax History
| Year | Tax Paid | Tax Assessment Tax Assessment Total Assessment is a certain percentage of the fair market value that is determined by local assessors to be the total taxable value of land and additions on the property. | Land | Improvement |
|---|---|---|---|---|
| 2025 | -- | $36,150 | $5,875 | $30,275 |
| 2024 | $873 | $36,150 | $5,875 | $30,275 |
| 2023 | $873 | $36,150 | $5,875 | $30,275 |
| 2022 | $969 | $29,200 | $3,825 | $25,375 |
| 2021 | $954 | $29,200 | $3,825 | $25,375 |
| 2020 | $903 | $27,650 | $3,825 | $23,825 |
| 2019 | $903 | $27,650 | $3,825 | $23,825 |
| 2018 | $893 | $27,650 | $3,825 | $23,825 |
| 2017 | $883 | $27,650 | $3,825 | $23,825 |
| 2016 | $935 | $28,075 | $4,025 | $24,050 |
| 2015 | $935 | $28,075 | $4,025 | $24,050 |
| 2014 | $931 | $27,950 | $4,025 | $23,925 |
Source: Public Records
Map
Nearby Homes
- 67 Shady Oaks Cove
- 0 Treeline Dr Unit 1510685
- 0 Treeline Dr Unit 5
- 0 Treeline Dr Unit 1510684
- 0 Treeline Dr Unit 4
- 919 John Burch Rd
- 74 Hardin Rd
- 0 Hardin Rd Unit 1523572
- 0 Hardin Rd Unit 1321169
- 150 Galloway Airport Rd
- 108 Galloway Airport Rd
- 3 Countryside Dr
- 00 Countryside Dr
- 0 Countryside Dr Unit RTC3035699
- 152 Highland Dr
- 109 Hidden Ridge Loop
- 27 Skyhigh Dr
- 0 Skyhigh Dr Unit 1533196
- 300 Skyhigh Dr
- 0 Skyhigh Dr Unit 1528243
- 711 John Burch Rd W
- 683 John Burch Rd
- 737 John Burch Rd
- 737 John Burch Rd W
- 706 John Burch Rd
- 651 John Burch Rd
- 664 John Burch Rd
- 11 Shady Oaks Cove
- 797 John Burch Rd
- 10 Shady Oaks Cove
- 68 Shady Oaks Dr
- 6 Applewood Ln
- 1 Shady Oaks Cove
- 1 Shady Oaks Cove Unit 1
- 463 John Burch Rd W
- 618 John Burch Rd
- 618 John Burch Rd
- 39 Applewood Ln
- 2 Shady Oaks Dr
- 2 Shady Oaks Dr Unit 9
Your Personal Tour Guide
Ask me questions while you tour the home.