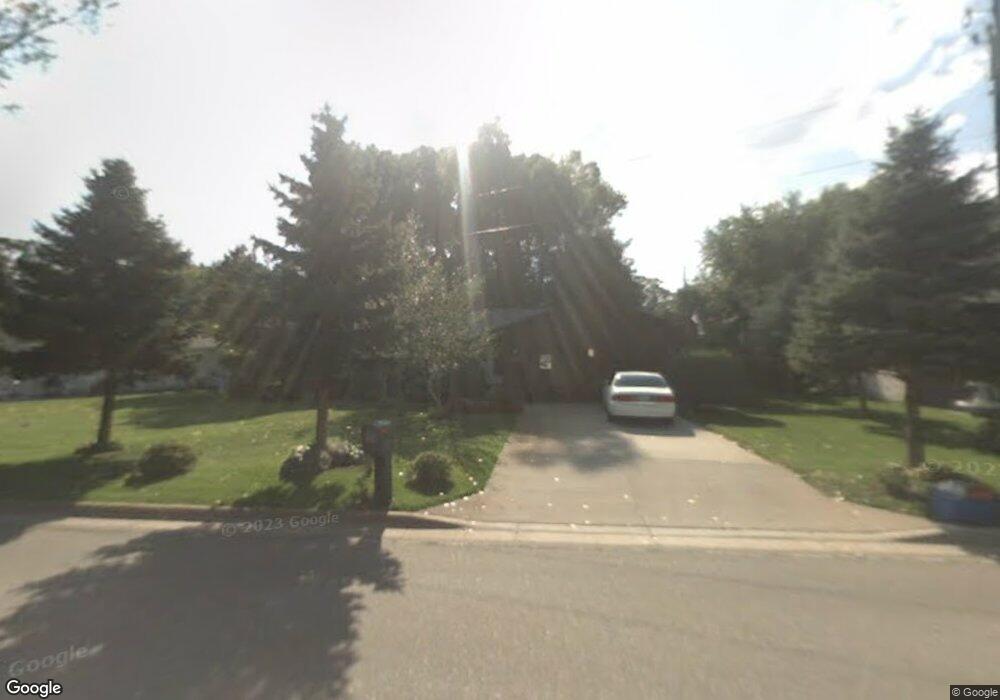
711 Lakeshore Dr Big Lake, MN 55309
Estimated Value: $350,000 - $430,000
3
Beds
3
Baths
1,880
Sq Ft
$206/Sq Ft
Est. Value
About This Home
This home is located at 711 Lakeshore Dr, Big Lake, MN 55309 and is currently estimated at $387,335, approximately $206 per square foot. 711 Lakeshore Dr is a home located in Sherburne County with nearby schools including Liberty Elementary School, Independence Elementary School, and Big Lake Middle School.
Ownership History
Date
Name
Owned For
Owner Type
Purchase Details
Closed on
Mar 31, 2021
Sold by
Anderson Amy M and Anderson Matthew D
Bought by
Foster Kyle A and Fowler Tate M
Current Estimated Value
Home Financials for this Owner
Home Financials are based on the most recent Mortgage that was taken out on this home.
Original Mortgage
$291,000
Outstanding Balance
$262,738
Interest Rate
3%
Mortgage Type
New Conventional
Estimated Equity
$124,597
Purchase Details
Closed on
Sep 25, 2017
Sold by
Christensen Mary L and Christensen Revocable T Mary L
Bought by
Anderson Amy M and Anderson Matthew D
Purchase Details
Closed on
Jun 22, 1999
Sold by
Mccormick Charlie Roy and Mccormick Lucille F
Bought by
Mary L Christensen Revocable Trust
Create a Home Valuation Report for This Property
The Home Valuation Report is an in-depth analysis detailing your home's value as well as a comparison with similar homes in the area
Home Values in the Area
Average Home Value in this Area
Purchase History
| Date | Buyer | Sale Price | Title Company |
|---|---|---|---|
| Foster Kyle A | $300,000 | Results Title | |
| Anderson Amy M | $194,000 | None Available | |
| Mary L Christensen Revocable Trust | $134,900 | -- | |
| Foster Kyle Kyle | $300,000 | -- |
Source: Public Records
Mortgage History
| Date | Status | Borrower | Loan Amount |
|---|---|---|---|
| Open | Foster Kyle A | $291,000 | |
| Closed | Foster Kyle Kyle | $300,000 |
Source: Public Records
Tax History Compared to Growth
Tax History
| Year | Tax Paid | Tax Assessment Tax Assessment Total Assessment is a certain percentage of the fair market value that is determined by local assessors to be the total taxable value of land and additions on the property. | Land | Improvement |
|---|---|---|---|---|
| 2025 | $4,138 | $342,300 | $93,100 | $249,200 |
| 2024 | $4,182 | $344,400 | $93,100 | $251,300 |
| 2023 | $4,176 | $348,200 | $98,300 | $249,900 |
| 2022 | $3,852 | $335,600 | $85,700 | $249,900 |
| 2020 | $3,492 | $249,600 | $53,200 | $196,400 |
| 2019 | $3,272 | $234,400 | $49,900 | $184,500 |
| 2018 | $3,136 | $218,400 | $45,500 | $172,900 |
| 2017 | $3,824 | $202,700 | $42,400 | $160,300 |
| 2016 | $3,786 | $190,200 | $39,100 | $151,100 |
| 2015 | $3,522 | $168,900 | $40,700 | $128,200 |
| 2014 | $2,479 | $162,300 | $40,400 | $121,900 |
| 2013 | -- | $140,300 | $38,900 | $101,400 |
Source: Public Records
Map
Nearby Homes
- 679 Lakeshore Dr
- 491 Highland Ave
- 241 Leighton Dr
- TBD Manitou St
- TBD Highway 10 NW
- 3300 Lake View Ln
- 20311 Gordon Ln
- 20050 County Road 81 NW
- 5008 Bluff Rd
- 4637 Pond View Cir
- 240 Wyoming Ave
- 3250 Lake Ridge Dr
- 4265 Lake Ridge Dr
- 20172 Truman Dr
- 20189 Esther Pkwy
- 1075 Kilbirnie Rd
- 5607 Egret Ave
- 110 Powell Cir E
- 637 Norwood Ln
- 5190 Edinburgh Way
- 721 Lakeshore Dr
- 600 Red Oak Dr
- 620 Red Oak Dr
- 731 Lakeshore Dr
- 699 Lakeshore Dr
- 640 Red Oak Dr
- 705 Shady Ln
- 120 Edgewater Place
- 711 Shady Ln
- 621 Red Oak Dr
- 644 Red Oak Dr
- 130 Edgewater Place
- 639 Red Oak Dr
- 750 Lakeshore Dr
- 170 Edgewater Place
- 721 Shady Ln
- 721 Shady Ln
- 721 Shady Ln
- 650 Red Oak Dr
- 639 Lakeshore Dr