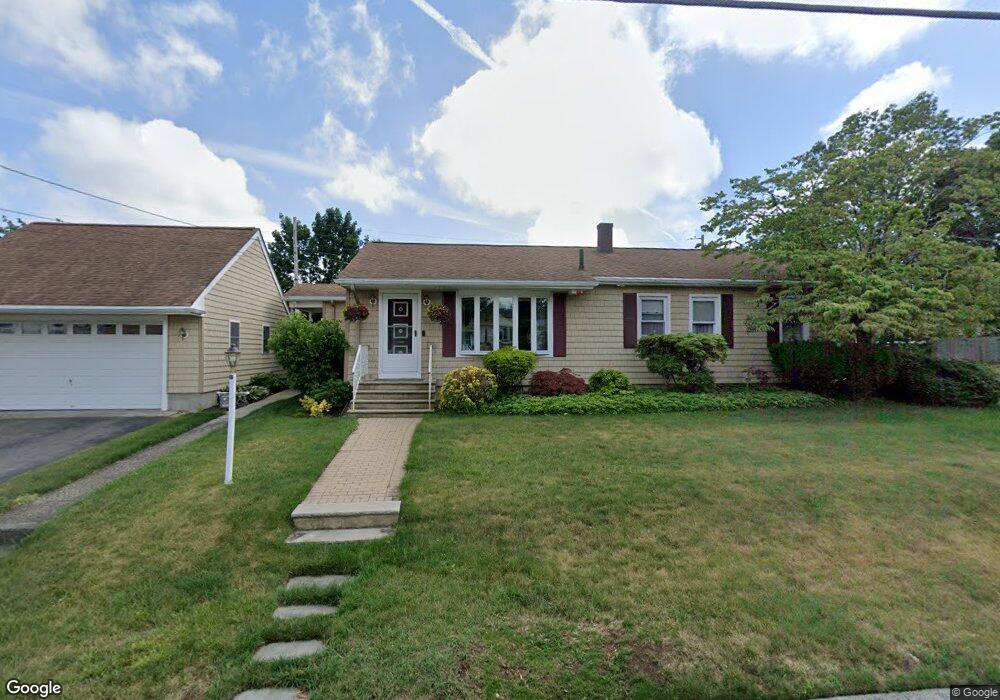
711 Langley St Fall River, MA 02720
Highlands-Fall River NeighborhoodEstimated Value: $449,876 - $487,000
3
Beds
2
Baths
1,841
Sq Ft
$254/Sq Ft
Est. Value
About This Home
This home is located at 711 Langley St, Fall River, MA 02720 and is currently estimated at $467,469, approximately $253 per square foot. 711 Langley St is a home located in Bristol County with nearby schools including James Tansey Elementary School, Morton Middle School, and B M C Durfee High School.
Ownership History
Date
Name
Owned For
Owner Type
Purchase Details
Closed on
Jul 29, 1976
Bought by
Kenyon John F and Kenyon Colleen M
Current Estimated Value
Create a Home Valuation Report for This Property
The Home Valuation Report is an in-depth analysis detailing your home's value as well as a comparison with similar homes in the area
Home Values in the Area
Average Home Value in this Area
Purchase History
| Date | Buyer | Sale Price | Title Company |
|---|---|---|---|
| Kenyon John F | $29,000 | -- |
Source: Public Records
Mortgage History
| Date | Status | Borrower | Loan Amount |
|---|---|---|---|
| Open | Kenyon John F | $26,000 | |
| Closed | Kenyon John F | $8,000 | |
| Closed | Kenyon John F | $10,498 | |
| Closed | Kenyon John F | $37,000 |
Source: Public Records
Tax History
| Year | Tax Paid | Tax Assessment Tax Assessment Total Assessment is a certain percentage of the fair market value that is determined by local assessors to be the total taxable value of land and additions on the property. | Land | Improvement |
|---|---|---|---|---|
| 2025 | $3,920 | $342,400 | $138,900 | $203,500 |
| 2024 | $3,691 | $321,200 | $133,600 | $187,600 |
| 2023 | $3,639 | $296,600 | $119,900 | $176,700 |
| 2022 | $3,240 | $256,700 | $111,000 | $145,700 |
| 2021 | $3,268 | $236,300 | $104,800 | $131,500 |
| 2020 | $3,169 | $219,300 | $100,900 | $118,400 |
| 2019 | $3,091 | $212,000 | $100,900 | $111,100 |
| 2018 | $3,059 | $209,200 | $100,900 | $108,300 |
| 2017 | $2,905 | $207,500 | $100,900 | $106,600 |
| 2016 | $2,761 | $202,600 | $100,900 | $101,700 |
| 2015 | $2,570 | $196,500 | $94,400 | $102,100 |
| 2014 | $2,472 | $196,500 | $94,400 | $102,100 |
Source: Public Records
Map
Nearby Homes
- 27 Kane St
- 247 Albany St
- 25 O'Hearn St
- 274 Archer St
- 333 Langley St
- 230 College Park Rd
- 208 Florence St
- 1231 Robeson St
- 201 Montgomery Cir
- 108 Stowe St Unit 108
- 164 Narragansett St
- 29 Valentine St
- 195 Crescent St Unit 3
- 160 Stewart St
- 257 Calvin St
- 301 Madison St
- 131 Stewart St Unit 2
- 131 Stewart St Unit 3A
- 1810 Highland Ave Unit 22
- 213 Weetamoe St
Your Personal Tour Guide
Ask me questions while you tour the home.