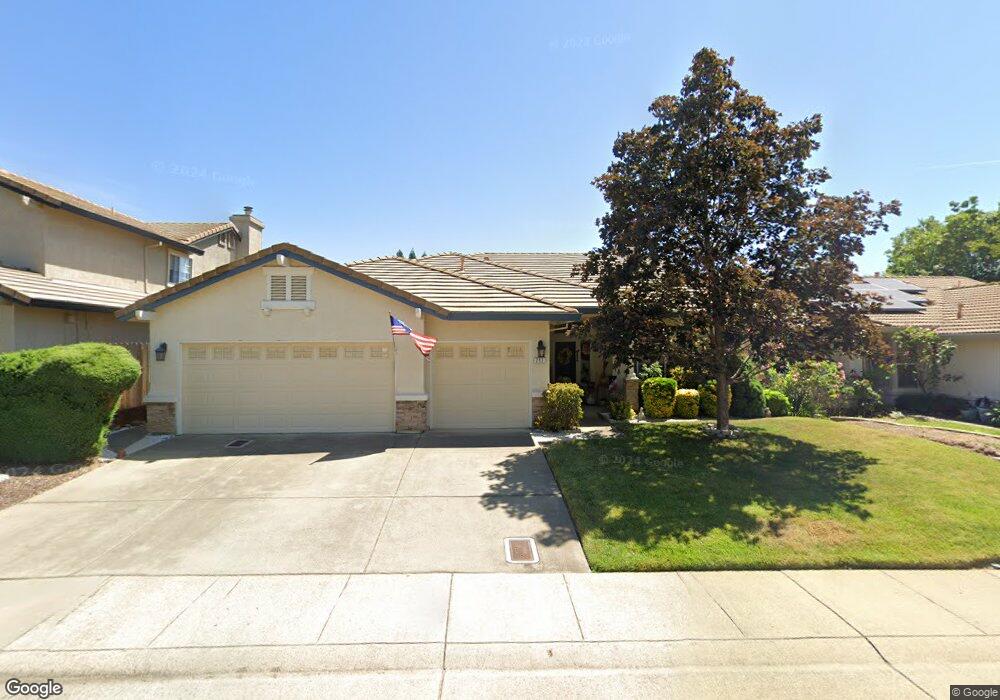
711 Larson Way Folsom, CA 95630
Estimated Value: $462,000 - $698,000
4
Beds
2
Baths
1,874
Sq Ft
$335/Sq Ft
Est. Value
About This Home
This home is located at 711 Larson Way, Folsom, CA 95630 and is currently estimated at $627,696, approximately $334 per square foot. 711 Larson Way is a home located in Sacramento County with nearby schools including Natoma Station Elementary School, Sutter Middle School, and Folsom High School.
Ownership History
Date
Name
Owned For
Owner Type
Purchase Details
Closed on
Oct 1, 2004
Sold by
Yenick John R and Yenick Esperanza V
Bought by
Yenick John R and Yenick Esperanza V
Current Estimated Value
Purchase Details
Closed on
Jan 2, 1997
Sold by
Ridgeview 49 Llc
Bought by
Yenick John R and Yenick Esperanza V
Home Financials for this Owner
Home Financials are based on the most recent Mortgage that was taken out on this home.
Original Mortgage
$146,760
Interest Rate
7.53%
Create a Home Valuation Report for This Property
The Home Valuation Report is an in-depth analysis detailing your home's value as well as a comparison with similar homes in the area
Purchase History
| Date | Buyer | Sale Price | Title Company |
|---|---|---|---|
| Yenick John R | -- | -- | |
| Yenick John R | $183,500 | Stewart Title |
Source: Public Records
Mortgage History
| Date | Status | Borrower | Loan Amount |
|---|---|---|---|
| Previous Owner | Yenick John R | $146,760 |
Source: Public Records
Tax History
| Year | Tax Paid | Tax Assessment Tax Assessment Total Assessment is a certain percentage of the fair market value that is determined by local assessors to be the total taxable value of land and additions on the property. | Land | Improvement |
|---|---|---|---|---|
| 2025 | $3,115 | $298,754 | $81,420 | $217,334 |
| 2024 | $3,115 | $292,897 | $79,824 | $213,073 |
| 2023 | $3,058 | $287,155 | $78,259 | $208,896 |
| 2022 | $3,012 | $281,525 | $76,725 | $204,800 |
| 2021 | $2,971 | $276,006 | $75,221 | $200,785 |
| 2020 | $2,933 | $273,177 | $74,450 | $198,727 |
| 2019 | $2,883 | $267,822 | $72,991 | $194,831 |
| 2018 | $2,810 | $262,571 | $71,560 | $191,011 |
| 2017 | $3,790 | $257,423 | $70,157 | $187,266 |
| 2016 | $3,918 | $252,377 | $68,782 | $183,595 |
| 2015 | $3,834 | $248,587 | $67,749 | $180,838 |
| 2014 | $3,705 | $243,718 | $66,422 | $177,296 |
Source: Public Records
Map
Nearby Homes
- 692 Humbert St
- 701 Ferrier Way
- 631 Rogers Cir
- 682 Diamond Glen Cir
- 157 Sutcliffe Cir
- 448 Gem Smith Place
- 469 Facet Place
- 467 Facet Place
- 503 Diamond Glen Cir
- 0 Figueroa St Unit 225034113
- 110 Lembi Dr
- 656 Silo St
- 510 Diamond Glen Cir
- 1002 Sibley St Unit 25
- 145 Hopfield Dr
- 206 Oxburough Dr
- 102 Black Gold Ln
- 104 Hesser Ct
- 617 Wales Dr
- 219 Needles Way
Your Personal Tour Guide
Ask me questions while you tour the home.