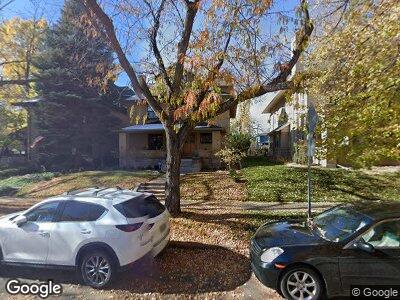
711 Marion St Denver, CO 80218
Country Club NeighborhoodEstimated Value: $1,599,926 - $2,107,000
6
Beds
5
Baths
3,255
Sq Ft
$581/Sq Ft
Est. Value
About This Home
This home is located at 711 Marion St, Denver, CO 80218 and is currently estimated at $1,889,982, approximately $580 per square foot. 711 Marion St is a home located in Denver County with nearby schools including Dora Moore ECE-8 School, Morey Middle School, and East High School.
Ownership History
Date
Name
Owned For
Owner Type
Purchase Details
Closed on
Aug 14, 2018
Sold by
Kelly Michael J and Gale Catherine C
Bought by
Michael J Kelly Revocable Trust and Catherine C Gale Revocable Trust
Current Estimated Value
Purchase Details
Closed on
Nov 16, 1998
Sold by
Butz Ronald C and Butz Mary H
Bought by
Kelly Michael J and Gale Catherine C
Home Financials for this Owner
Home Financials are based on the most recent Mortgage that was taken out on this home.
Original Mortgage
$440,800
Interest Rate
4.37%
Purchase Details
Closed on
Nov 6, 1998
Sold by
Riggs Ralph E
Bought by
Butz Ronald C and Butz Mary H
Home Financials for this Owner
Home Financials are based on the most recent Mortgage that was taken out on this home.
Original Mortgage
$440,800
Interest Rate
4.37%
Create a Home Valuation Report for This Property
The Home Valuation Report is an in-depth analysis detailing your home's value as well as a comparison with similar homes in the area
Home Values in the Area
Average Home Value in this Area
Purchase History
| Date | Buyer | Sale Price | Title Company |
|---|---|---|---|
| Michael J Kelly Revocable Trust | -- | None Available | |
| Kelly Michael J | $551,000 | Land Title | |
| Butz Ronald C | -- | Land Title |
Source: Public Records
Mortgage History
| Date | Status | Borrower | Loan Amount |
|---|---|---|---|
| Open | Kelly Michael J | $335,000 | |
| Closed | Kelly Michael J | $350,000 | |
| Closed | Kelly Michael J | $374,300 | |
| Closed | Kelly Michael J | $379,000 | |
| Closed | Kelly Michael J | $383,500 | |
| Closed | Kelly Michael J | $393,000 | |
| Closed | Kelly Michael J | $399,500 | |
| Closed | Kelly Michael J | $407,500 | |
| Closed | Kelly Michael J | $417,000 | |
| Closed | Kelly Michael J | $417,000 | |
| Closed | Kelly Michael J | $418,700 | |
| Closed | Kelly Michael J | $414,600 | |
| Closed | Kelly Michael J | $440,800 |
Source: Public Records
Tax History Compared to Growth
Tax History
| Year | Tax Paid | Tax Assessment Tax Assessment Total Assessment is a certain percentage of the fair market value that is determined by local assessors to be the total taxable value of land and additions on the property. | Land | Improvement |
|---|---|---|---|---|
| 2024 | $7,839 | $105,680 | $32,250 | $73,430 |
| 2023 | $7,670 | $105,680 | $32,250 | $73,430 |
| 2022 | $5,871 | $80,780 | $37,270 | $43,510 |
| 2021 | $5,669 | $83,120 | $38,350 | $44,770 |
| 2020 | $5,571 | $82,240 | $29,630 | $52,610 |
| 2019 | $5,931 | $82,240 | $29,630 | $52,610 |
| 2018 | $5,095 | $65,860 | $26,320 | $39,540 |
| 2017 | $5,080 | $65,860 | $26,320 | $39,540 |
| 2016 | $4,623 | $56,690 | $29,102 | $27,588 |
| 2015 | $4,429 | $56,690 | $29,102 | $27,588 |
| 2014 | $3,547 | $42,710 | $20,600 | $22,110 |
Source: Public Records
Map
Nearby Homes
- 747 N Downing St
- 761 Lafayette St
- 780 Lafayette St
- 728 N Ogden St
- 570 N Downing St
- 1029 E 8th Ave Unit 901
- 1029 E 8th Ave Unit 1302
- 930 E 7th Ave
- 637 Franklin St
- 680 Emerson St
- 861 N Humboldt St Unit A
- 758 Franklin St
- 844 N Humboldt St Unit 5
- 780 Franklin St
- 677 N Gilpin St
- 963 N Lafayette St
- 652 Gilpin St
- 805 E 7th Ave Unit 8
- 486 Corona St
- 940 N Ogden St