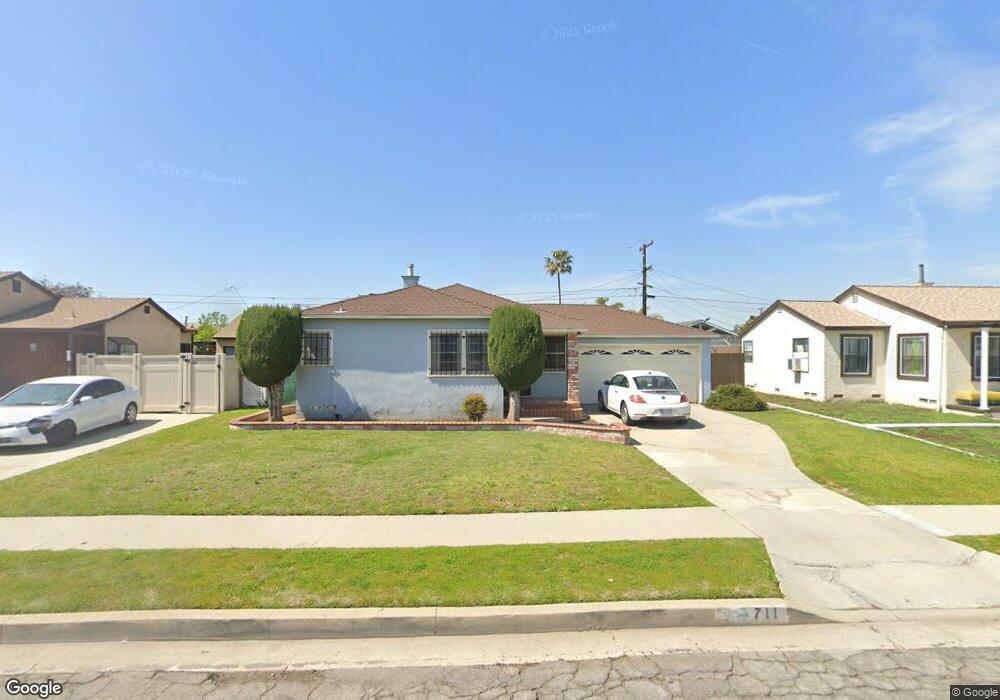
711 N Broadacres Ave Compton, CA 90220
Estimated Value: $562,000 - $632,000
2
Beds
1
Bath
831
Sq Ft
$719/Sq Ft
Est. Value
About This Home
This home is located at 711 N Broadacres Ave, Compton, CA 90220 and is currently estimated at $597,614, approximately $719 per square foot. 711 N Broadacres Ave is a home located in Los Angeles County with nearby schools including Tibby Elementary School, Enterprise Middle School, and Compton High School.
Ownership History
Date
Name
Owned For
Owner Type
Purchase Details
Closed on
Aug 9, 2010
Sold by
Ggb Properties Lp
Bought by
Meeks Gwendolyn
Current Estimated Value
Home Financials for this Owner
Home Financials are based on the most recent Mortgage that was taken out on this home.
Original Mortgage
$209,183
Interest Rate
4.5%
Mortgage Type
FHA
Purchase Details
Closed on
Apr 26, 2010
Sold by
Gmac Mortgage Llc
Bought by
Ggb Properties Lp
Purchase Details
Closed on
Sep 16, 2009
Sold by
Burrell Bettie L
Bought by
Gmac Mortgage Llc and Gmac Mortgage Corporation
Purchase Details
Closed on
Apr 14, 2005
Sold by
Ciampa Seramaire
Bought by
Burrell Bettie L
Home Financials for this Owner
Home Financials are based on the most recent Mortgage that was taken out on this home.
Original Mortgage
$247,500
Interest Rate
1%
Mortgage Type
New Conventional
Create a Home Valuation Report for This Property
The Home Valuation Report is an in-depth analysis detailing your home's value as well as a comparison with similar homes in the area
Home Values in the Area
Average Home Value in this Area
Purchase History
| Date | Buyer | Sale Price | Title Company |
|---|---|---|---|
| Meeks Gwendolyn | $212,000 | Lsi | |
| Ggb Properties Lp | $127,000 | Lsi Title Agency | |
| Gmac Mortgage Llc | $114,750 | None Available | |
| Burrell Bettie L | $330,000 | United Independent Title |
Source: Public Records
Mortgage History
| Date | Status | Borrower | Loan Amount |
|---|---|---|---|
| Previous Owner | Meeks Gwendolyn | $209,183 | |
| Previous Owner | Burrell Bettie L | $247,500 | |
| Closed | Burrell Bettie L | $49,500 |
Source: Public Records
Tax History
| Year | Tax Paid | Tax Assessment Tax Assessment Total Assessment is a certain percentage of the fair market value that is determined by local assessors to be the total taxable value of land and additions on the property. | Land | Improvement |
|---|---|---|---|---|
| 2025 | $5,137 | $271,597 | $135,415 | $136,182 |
| 2024 | $5,137 | $266,272 | $132,760 | $133,512 |
| 2023 | $5,069 | $261,052 | $130,157 | $130,895 |
| 2022 | $5,101 | $255,934 | $127,605 | $128,329 |
| 2021 | $4,510 | $250,916 | $125,103 | $125,813 |
| 2019 | $4,672 | $243,476 | $121,394 | $122,082 |
| 2018 | $4,546 | $238,703 | $119,014 | $119,689 |
| 2016 | $4,310 | $229,437 | $114,394 | $115,043 |
| 2015 | $4,128 | $225,991 | $112,676 | $113,315 |
| 2014 | $4,056 | $221,565 | $110,469 | $111,096 |
Source: Public Records
Map
Nearby Homes
- 800 N Kalsman Ave
- 316 N Maie Ave
- 940 W Brazil St
- 836 W Cedar St
- 1317 W School St
- 213 N Broadacres Ave
- 814 W Maple St
- 910 W Palmer St
- 806 W Spruce St
- 910 W 138th St
- 485 W Compton Blvd
- 9607 S Evers Ave
- 14016 S Albertson Ave
- 14003 S Nestor Ave
- 1616 W Palmer St
- 969 W Dhalia St
- 1201 W 138th St
- 720 W Cherry St
- 820 W Compton Blvd Unit 17
- 1498 W Compton Blvd
- 803 N Broadacres Ave
- 707 N Broadacres Ave
- 710 N Cliveden Ave
- 706 N Cliveden Ave
- 807 N Broadacres Ave
- 703 N Broadacres Ave
- 802 N Cliveden Ave
- 702 N Cliveden Ave
- 710 N Broadacres Ave
- 806 N Cliveden Ave
- 802 N Broadacres Ave
- 706 N Broadacres Ave
- 811 N Broadacres Ave
- 615 N Broadacres Ave
- 806 N Broadacres Ave
- 702 N Broadacres Ave
- 614 N Cliveden Ave
- 810 N Cliveden Ave
- 810 N Broadacres Ave
- 614 N Broadacres Ave
Your Personal Tour Guide
Ask me questions while you tour the home.