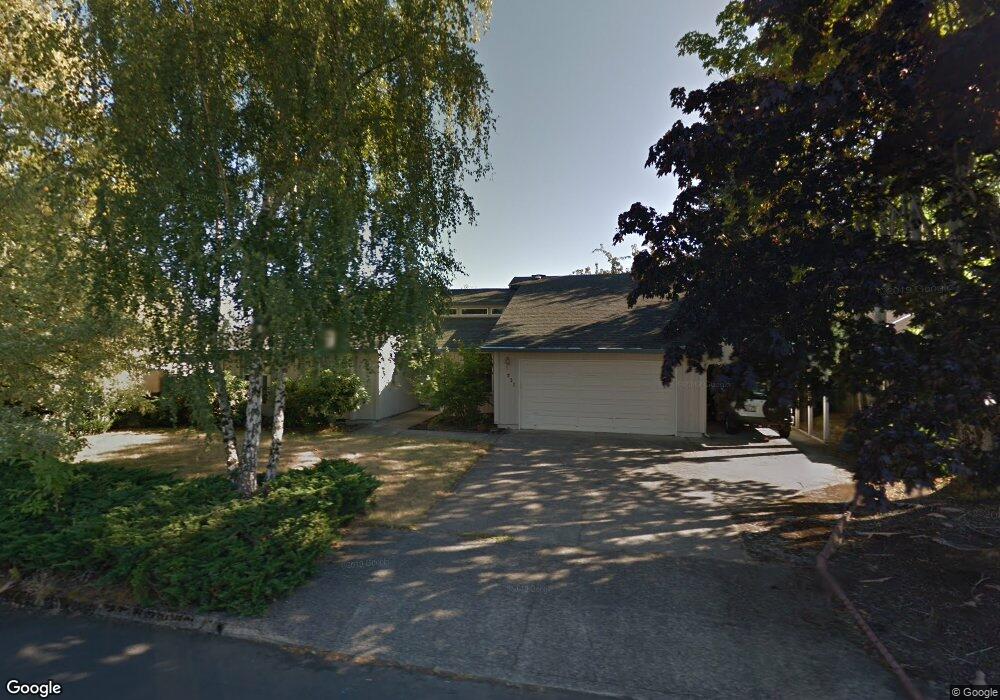
711 NE 130th St Vancouver, WA 98685
Knapp NeighborhoodEstimated Value: $535,000 - $574,000
4
Beds
3
Baths
2,072
Sq Ft
$269/Sq Ft
Est. Value
About This Home
This home is located at 711 NE 130th St, Vancouver, WA 98685 and is currently estimated at $557,293, approximately $268 per square foot. 711 NE 130th St is a home located in Clark County with nearby schools including Salmon Creek Elementary School, Alki Middle School, and Skyview High School.
Ownership History
Date
Name
Owned For
Owner Type
Purchase Details
Closed on
Aug 11, 2017
Sold by
Gibson Joseph and Zhao Xiaoping
Bought by
Smith Daemon and Anderson Aubre
Current Estimated Value
Home Financials for this Owner
Home Financials are based on the most recent Mortgage that was taken out on this home.
Original Mortgage
$10,745
Outstanding Balance
$8,983
Interest Rate
4.03%
Mortgage Type
Unknown
Estimated Equity
$548,310
Purchase Details
Closed on
Aug 9, 2017
Sold by
Tang Tang
Bought by
Zhao Xioaping
Home Financials for this Owner
Home Financials are based on the most recent Mortgage that was taken out on this home.
Original Mortgage
$10,745
Outstanding Balance
$8,983
Interest Rate
4.03%
Mortgage Type
Unknown
Estimated Equity
$548,310
Purchase Details
Closed on
Nov 9, 2016
Sold by
Anson Mary L and Anson Francis E
Bought by
Gibson Joseph and Zhao Xiaoping
Create a Home Valuation Report for This Property
The Home Valuation Report is an in-depth analysis detailing your home's value as well as a comparison with similar homes in the area
Home Values in the Area
Average Home Value in this Area
Purchase History
| Date | Buyer | Sale Price | Title Company |
|---|---|---|---|
| Smith Daemon | $307,000 | First Amer Title Vancouver | |
| Zhao Xioaping | -- | First Amer Title Vancouver | |
| Gibson Joseph | -- | First Amer Title Vancouver | |
| Gibson Joseph | $270,000 | Fidelity Title Fl Vancouver |
Source: Public Records
Mortgage History
| Date | Status | Borrower | Loan Amount |
|---|---|---|---|
| Open | Smith Daemon | $10,745 | |
| Open | Smith Daemon | $301,439 | |
| Closed | Gibson Joseph | $10,745 |
Source: Public Records
Tax History Compared to Growth
Tax History
| Year | Tax Paid | Tax Assessment Tax Assessment Total Assessment is a certain percentage of the fair market value that is determined by local assessors to be the total taxable value of land and additions on the property. | Land | Improvement |
|---|---|---|---|---|
| 2025 | $5,103 | $527,376 | $216,200 | $311,176 |
| 2024 | $4,845 | $482,919 | $216,200 | $266,719 |
| 2023 | $4,672 | $516,546 | $223,250 | $293,296 |
| 2022 | $4,340 | $474,243 | $223,250 | $250,993 |
| 2021 | $4,127 | $392,225 | $140,000 | $252,225 |
| 2020 | $3,689 | $349,963 | $128,000 | $221,963 |
| 2019 | $3,466 | $332,133 | $128,000 | $204,133 |
| 2018 | $3,663 | $323,814 | $0 | $0 |
| 2017 | $3,236 | $285,548 | $0 | $0 |
| 2016 | $1,075 | $127,660 | $0 | $0 |
| 2015 | $1,662 | $127,660 | $0 | $0 |
| 2014 | -- | $196,400 | $0 | $0 |
| 2013 | -- | $196,400 | $0 | $0 |
Source: Public Records
Map
Nearby Homes
- 508 NE 127th St
- 12704 NE 11th Place
- 911 NE Tenney Rd
- 13419 NE 6th Ct
- 1312 NE 131st Cir
- 306 NW 134th St
- 12445 NE Plantation Rd
- 316 NE Bassel Rd
- 317 NE Bassel Rd
- 14204 NE 10th Ave Unit 33
- 14204 NE 10th Ave
- 1207 NE Knowles Dr
- 211 NE 117th St
- 701 NE 117th St
- 14217 NE 10th Ave
- 1317 NE 143rd St
- 1110 NE 115th St
- 405 NE 115th Cir
- 11620 NW 2nd Ct
- 13114 NW 8th Way Unit B
- 803 NE 130th St
- 705 NE 130th St
- 712 NE 129th St
- 12905 NE 7th Ave
- 804 NE 129th St
- 712 NE 130th St
- 809 NE 130th St
- 704 NE 130th St
- 804 NE 130th St
- 810 NE 129th St
- 12912 NE 7th Ave
- 12918 NE 7th Ave
- 13013 NE 7th Ave
- 812 NE 130th St
- 817 NE 130th St
- 717 NE 129th St
- 12904 NE 7th Ave
- 805 NE 129th St
- 707 NE 129th St
- 13102 NE 8th Ct