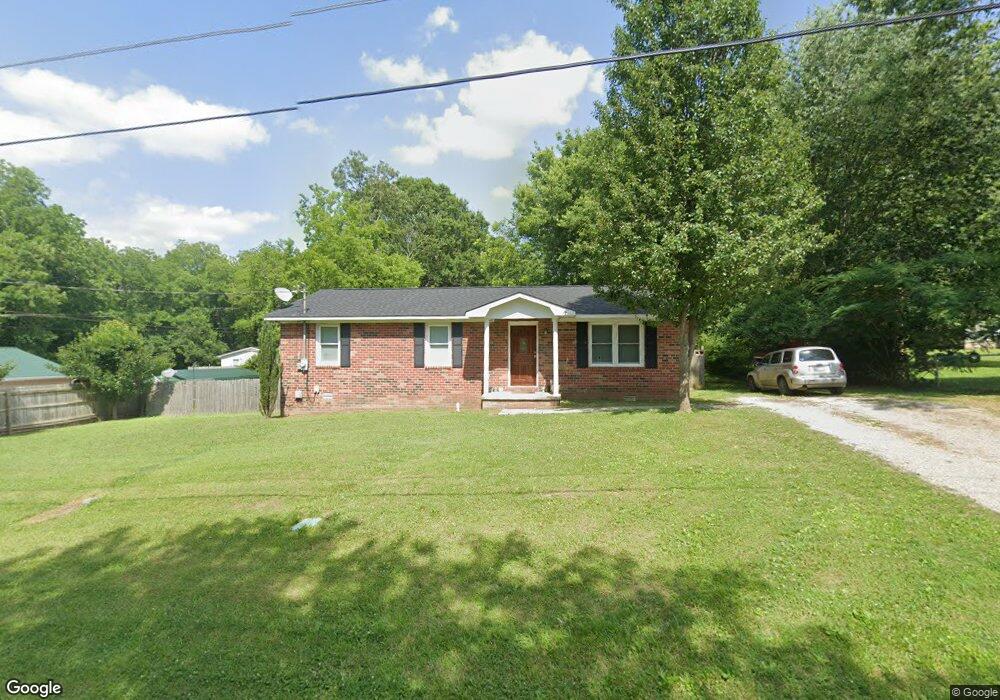
711 Oak St Manchester, TN 37355
Estimated Value: $161,000 - $211,000
--
Bed
1
Bath
1,150
Sq Ft
$163/Sq Ft
Est. Value
About This Home
This home is located at 711 Oak St, Manchester, TN 37355 and is currently estimated at $187,284, approximately $162 per square foot. 711 Oak St is a home located in Coffee County with nearby schools including Westwood Middle School and Temple Baptist Christian School.
Ownership History
Date
Name
Owned For
Owner Type
Purchase Details
Closed on
Jan 14, 2020
Sold by
Griggs Allen D
Bought by
Mullins David and Mullins Tracy
Current Estimated Value
Purchase Details
Closed on
Mar 11, 2016
Sold by
Belew John P Stacy
Bought by
Griggs Allen D
Purchase Details
Closed on
Aug 16, 2010
Sold by
Griggs Ann
Bought by
Belew John P
Purchase Details
Closed on
May 5, 2010
Bought by
Griggs Ann
Purchase Details
Closed on
Dec 21, 2007
Sold by
Griggs Ann
Bought by
Gwinn Christi
Purchase Details
Closed on
Dec 29, 1994
Bought by
Griggs Ann
Create a Home Valuation Report for This Property
The Home Valuation Report is an in-depth analysis detailing your home's value as well as a comparison with similar homes in the area
Home Values in the Area
Average Home Value in this Area
Purchase History
| Date | Buyer | Sale Price | Title Company |
|---|---|---|---|
| Mullins David | $63,000 | None Available | |
| Griggs Allen D | -- | -- | |
| Griggs Allen D | $50,000 | -- | |
| Belew John P | $50,000 | -- | |
| Griggs Ann | $50,000 | -- | |
| Gwinn Christi | $77,000 | -- | |
| Griggs Ann | $29,800 | -- |
Source: Public Records
Tax History Compared to Growth
Tax History
| Year | Tax Paid | Tax Assessment Tax Assessment Total Assessment is a certain percentage of the fair market value that is determined by local assessors to be the total taxable value of land and additions on the property. | Land | Improvement |
|---|---|---|---|---|
| 2024 | $1,104 | $26,175 | $3,750 | $22,425 |
| 2023 | $1,104 | $26,175 | $0 | $0 |
| 2022 | $950 | $26,175 | $3,750 | $22,425 |
| 2021 | $971 | $21,200 | $3,750 | $17,450 |
| 2020 | $971 | $21,200 | $3,750 | $17,450 |
| 2019 | $971 | $21,200 | $3,750 | $17,450 |
| 2018 | $971 | $21,200 | $3,750 | $17,450 |
| 2017 | $986 | $18,800 | $3,750 | $15,050 |
| 2016 | $986 | $18,800 | $3,750 | $15,050 |
| 2015 | $986 | $18,800 | $3,750 | $15,050 |
| 2014 | $986 | $18,801 | $0 | $0 |
Source: Public Records
Map
Nearby Homes