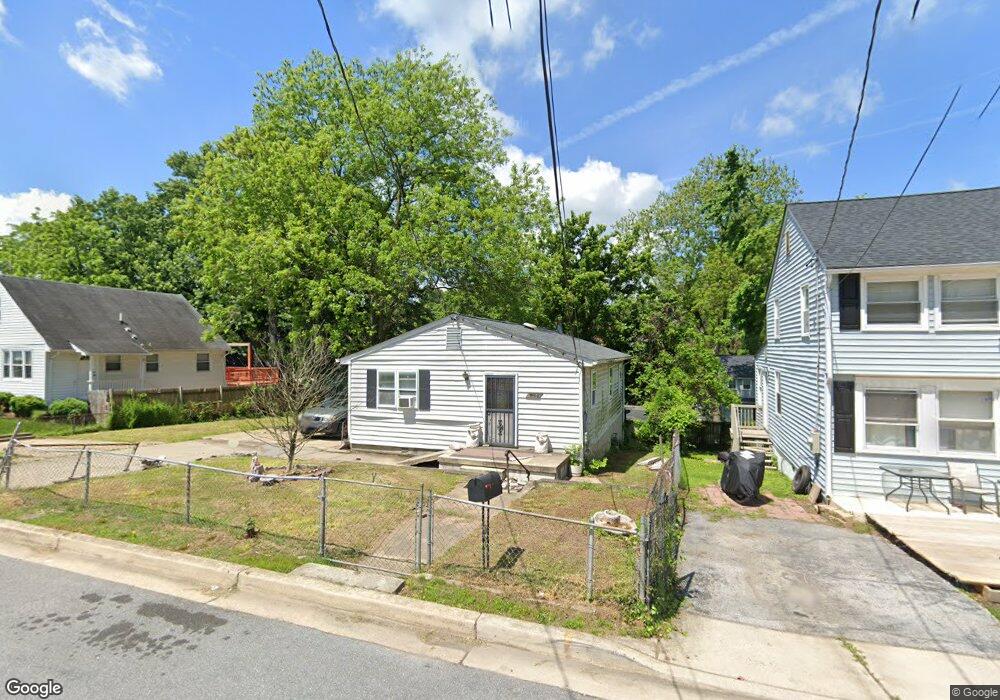
711 Opus Ave Capitol Heights, MD 20743
Estimated Value: $281,306 - $371,000
--
Bed
1
Bath
936
Sq Ft
$352/Sq Ft
Est. Value
About This Home
This home is located at 711 Opus Ave, Capitol Heights, MD 20743 and is currently estimated at $329,077, approximately $351 per square foot. 711 Opus Ave is a home located in Prince George's County with nearby schools including William W. Hall Academy, Central High School, and DC Scholars Public Charter School.
Ownership History
Date
Name
Owned For
Owner Type
Purchase Details
Closed on
May 17, 2007
Sold by
Barnhardt Kevin J
Bought by
Barnhardt Patricia W
Current Estimated Value
Purchase Details
Closed on
Feb 27, 1998
Sold by
Webster Pedro A
Bought by
Barnhardt Kevin J
Purchase Details
Closed on
Jun 27, 1997
Sold by
Home Savings Of America Fsb
Bought by
Webster Pedro A
Purchase Details
Closed on
Jun 19, 1997
Sold by
Dent Joseph F and Dent Judy B
Bought by
Home Savings Of America Fsb
Create a Home Valuation Report for This Property
The Home Valuation Report is an in-depth analysis detailing your home's value as well as a comparison with similar homes in the area
Home Values in the Area
Average Home Value in this Area
Purchase History
| Date | Buyer | Sale Price | Title Company |
|---|---|---|---|
| Barnhardt Patricia W | -- | -- | |
| Barnhardt Patricia W | -- | -- | |
| Barnhardt Kevin J | $125,000 | -- | |
| Webster Pedro A | $38,000 | -- | |
| Home Savings Of America Fsb | $80,000 | -- |
Source: Public Records
Tax History Compared to Growth
Tax History
| Year | Tax Paid | Tax Assessment Tax Assessment Total Assessment is a certain percentage of the fair market value that is determined by local assessors to be the total taxable value of land and additions on the property. | Land | Improvement |
|---|---|---|---|---|
| 2025 | $4,055 | $310,500 | -- | -- |
| 2024 | $4,055 | $287,200 | $0 | $0 |
| 2023 | $3,858 | $263,900 | $61,000 | $202,900 |
| 2022 | $3,376 | $244,867 | $0 | $0 |
| 2021 | $2,873 | $225,833 | $0 | $0 |
| 2020 | $6,094 | $206,800 | $45,500 | $161,300 |
| 2019 | $3,335 | $195,033 | $0 | $0 |
| 2018 | $1,004 | $183,267 | $0 | $0 |
| 2017 | $3,131 | $171,500 | $0 | $0 |
| 2016 | -- | $162,033 | $0 | $0 |
| 2015 | $2,861 | $152,567 | $0 | $0 |
| 2014 | $2,861 | $143,100 | $0 | $0 |
Source: Public Records
Map
Nearby Homes