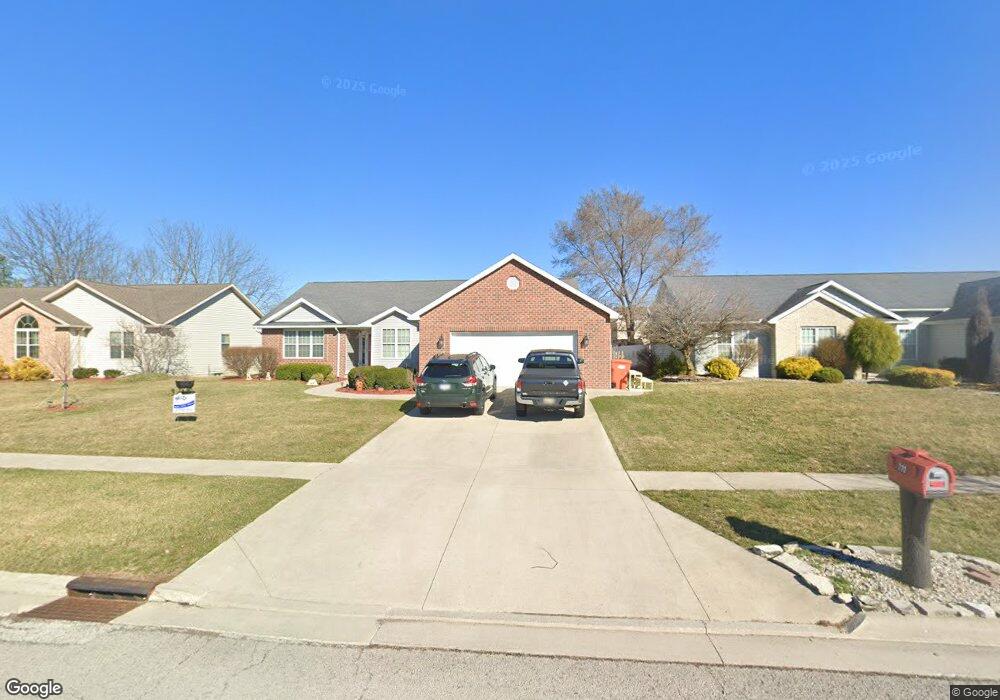
711 Remington St Findlay, OH 45840
Estimated Value: $324,000 - $342,000
3
Beds
2
Baths
1,914
Sq Ft
$174/Sq Ft
Est. Value
About This Home
This home is located at 711 Remington St, Findlay, OH 45840 and is currently estimated at $333,280, approximately $174 per square foot. 711 Remington St is a home located in Hancock County with nearby schools including Wilson Vance Elementary School, Whittier Elementary School, and Donnell Middle School.
Ownership History
Date
Name
Owned For
Owner Type
Purchase Details
Closed on
Aug 23, 2019
Sold by
Harmon Rebecca L
Bought by
Harvey Brad A
Current Estimated Value
Home Financials for this Owner
Home Financials are based on the most recent Mortgage that was taken out on this home.
Original Mortgage
$212,325
Outstanding Balance
$185,957
Interest Rate
3.7%
Mortgage Type
New Conventional
Estimated Equity
$147,323
Purchase Details
Closed on
Apr 2, 2010
Sold by
The Huntington National Bank
Bought by
Winebar Clair S and Winebar Diana M
Purchase Details
Closed on
Jan 21, 2005
Sold by
Fett Robert A and Rooney Sharon J
Bought by
Sky Trust Na
Purchase Details
Closed on
Jul 28, 2004
Sold by
Country Club Acres Inc
Bought by
Fett Robert A
Create a Home Valuation Report for This Property
The Home Valuation Report is an in-depth analysis detailing your home's value as well as a comparison with similar homes in the area
Home Values in the Area
Average Home Value in this Area
Purchase History
| Date | Buyer | Sale Price | Title Company |
|---|---|---|---|
| Harvey Brad A | $223,500 | Flag City Title Agency Inc | |
| Winebar Clair S | $178,000 | Hancock Title Agency | |
| Sky Trust Na | $198,500 | Assured Title Agency | |
| Fett Robert A | $33,500 | -- |
Source: Public Records
Mortgage History
| Date | Status | Borrower | Loan Amount |
|---|---|---|---|
| Open | Harvey Brad A | $212,325 |
Source: Public Records
Tax History Compared to Growth
Tax History
| Year | Tax Paid | Tax Assessment Tax Assessment Total Assessment is a certain percentage of the fair market value that is determined by local assessors to be the total taxable value of land and additions on the property. | Land | Improvement |
|---|---|---|---|---|
| 2024 | $2,981 | $83,920 | $12,550 | $71,370 |
| 2023 | $2,986 | $83,920 | $12,550 | $71,370 |
| 2022 | $2,975 | $83,920 | $12,550 | $71,370 |
| 2021 | $2,829 | $69,460 | $11,740 | $57,720 |
| 2020 | $2,827 | $69,460 | $11,740 | $57,720 |
| 2019 | $2,770 | $69,460 | $11,740 | $57,720 |
| 2018 | $2,641 | $60,780 | $7,820 | $52,960 |
| 2017 | $1,321 | $60,780 | $7,820 | $52,960 |
| 2016 | $2,604 | $60,780 | $7,820 | $52,960 |
| 2015 | $2,533 | $57,930 | $8,300 | $49,630 |
| 2014 | $2,533 | $57,930 | $8,300 | $49,630 |
| 2012 | $2,911 | $66,090 | $8,300 | $57,790 |
Source: Public Records
Map
Nearby Homes
- 1000 Tarra Oaks Dr
- 1464 Misty Oaks Dr
- 1463 Misty Oaks Dr
- 619 Fishlock Ave
- 516 Cranberry W
- 1037 Fishlock Ave
- 1802 Lippincott Ave
- 1010 Country Creek Dr
- 15591 Canadian Way
- 15586 Canadian Way
- 15615 Canadian Way
- 1301 Fishlock Ave
- 1001 Decker Ave
- 309 Huron Rd
- 1109 Brookside Dr
- 0 Blanchard Ave
- 820 Selby St
- 1006 Selby St
- 1200 5th St
- 210 Eastowne Park Row
- 721 Remington St
- 701 Remington St
- 710 Remington St
- 710 Colt Dr
- 691 Remington St
- 731 Remington St
- 720 Colt Dr
- 700 Colt Dr
- 1250 Remington St
- 17 Ithica Ct
- 0 Ithica Ct Unit H125969
- 0 Ithica Ct Unit H125971
- 13 Ithica Ct
- 730 Colt Dr
- 690 Colt Dr
- 700 Remington St
- 741 Remington St
- 681 Remington St
- 1250 Ithica Ct
- 690 Remington St