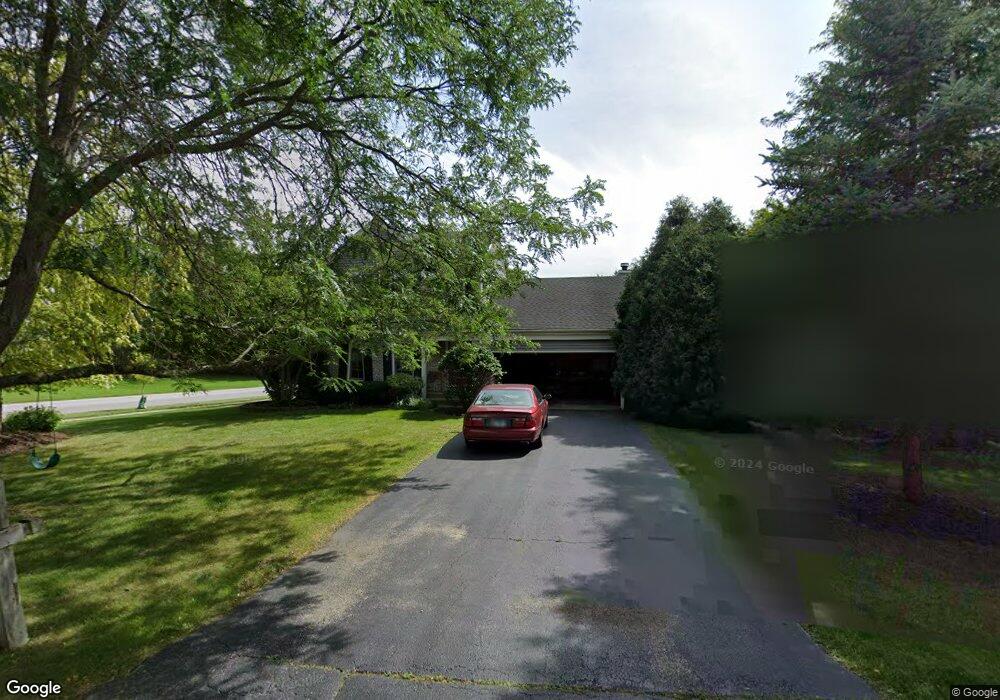
711 River Oaks Ln Unit 2 Island Lake, IL 60042
East Island Lake NeighborhoodEstimated Value: $308,000 - $365,000
3
Beds
2
Baths
1,591
Sq Ft
$216/Sq Ft
Est. Value
About This Home
This home is located at 711 River Oaks Ln Unit 2, Island Lake, IL 60042 and is currently estimated at $343,564, approximately $215 per square foot. 711 River Oaks Ln Unit 2 is a home located in Lake County with nearby schools including Cotton Creek School, Matthews Middle School, and Wauconda High School.
Ownership History
Date
Name
Owned For
Owner Type
Purchase Details
Closed on
Jun 27, 2001
Sold by
Anna Summy Thomas and Anna Stambrowsky
Bought by
Amato Colleen A
Current Estimated Value
Home Financials for this Owner
Home Financials are based on the most recent Mortgage that was taken out on this home.
Original Mortgage
$163,600
Outstanding Balance
$78,732
Interest Rate
10.65%
Estimated Equity
$264,832
Purchase Details
Closed on
Jun 30, 1999
Sold by
Zerfahs Kenneth F and Zerfahs Tracy E
Bought by
Anna Summy Thomas and Anna Stambrowsky
Home Financials for this Owner
Home Financials are based on the most recent Mortgage that was taken out on this home.
Original Mortgage
$140,100
Interest Rate
7.28%
Mortgage Type
Balloon
Purchase Details
Closed on
Oct 28, 1998
Sold by
Zerfahs Kenneth F
Bought by
Zerfahs Kenneth F and Zerfahs Tracy E
Home Financials for this Owner
Home Financials are based on the most recent Mortgage that was taken out on this home.
Original Mortgage
$120,001
Interest Rate
6.8%
Create a Home Valuation Report for This Property
The Home Valuation Report is an in-depth analysis detailing your home's value as well as a comparison with similar homes in the area
Home Values in the Area
Average Home Value in this Area
Purchase History
| Date | Buyer | Sale Price | Title Company |
|---|---|---|---|
| Amato Colleen A | $204,500 | Prairie Title | |
| Anna Summy Thomas | $176,000 | -- | |
| Zerfahs Kenneth F | -- | -- |
Source: Public Records
Mortgage History
| Date | Status | Borrower | Loan Amount |
|---|---|---|---|
| Open | Amato Colleen A | $163,600 | |
| Previous Owner | Anna Summy Thomas | $140,100 | |
| Previous Owner | Zerfahs Kenneth F | $120,001 |
Source: Public Records
Tax History Compared to Growth
Tax History
| Year | Tax Paid | Tax Assessment Tax Assessment Total Assessment is a certain percentage of the fair market value that is determined by local assessors to be the total taxable value of land and additions on the property. | Land | Improvement |
|---|---|---|---|---|
| 2024 | $4,042 | $88,373 | $21,571 | $66,802 |
| 2023 | $6,001 | $80,780 | $19,718 | $61,062 |
| 2022 | $6,001 | $72,937 | $21,352 | $51,585 |
| 2021 | $5,376 | $68,919 | $20,176 | $48,743 |
| 2020 | $5,963 | $65,687 | $19,230 | $46,457 |
| 2019 | $5,249 | $62,080 | $18,174 | $43,906 |
| 2018 | $5,775 | $62,209 | $21,539 | $40,670 |
| 2017 | $5,769 | $61,490 | $21,290 | $40,200 |
| 2016 | $5,477 | $58,229 | $20,161 | $38,068 |
| 2015 | $5,255 | $53,455 | $18,508 | $34,947 |
| 2014 | $5,049 | $49,406 | $17,303 | $32,103 |
| 2012 | $4,922 | $53,127 | $16,556 | $36,571 |
Source: Public Records
Map
Nearby Homes
- 3828 Eastway Dr
- 4342 Shooting Star Dr Unit 142
- 27692 N Oak St
- 28094 E State Rd
- 216 S Shore Dr Unit S
- 228 S Shore Dr
- 3819 Woodlawn Dr
- 4410 Shooting Star Ct
- 27569 N Beech St
- 236 Forest Dr
- 00 Burnett Rd
- 27405 N Roberts Ln
- 706 E Burnett Rd
- lot 23 Park Dr
- NEC Route 176 & Westridge Dr
- 318 David Ct
- 27125 N Williams Park Rd
- 28406 W Park Ave
- 26958 N Ellen St
- 114 Maple St
- 705 River Oaks Ln
- 803 River Oaks Ct
- 710 Longacre Ln Unit 2
- 703 River Oaks Ln
- 706 Longacre Ln
- 802 Longacre Ct
- 710 River Oaks Ln
- 714 River Oaks Ln
- 805 River Oaks Ct
- 706 River Oaks Ln
- 621 River Oaks Ln
- 704 Longacre Ln
- 804 Longacre Ct
- 702 River Oaks Ln
- 802 River Oaks Ct
- 619 River Oaks Ln
- 809 River Oaks Ct Unit 2
- 620 Longacre Ln
- 620 River Oaks Ln
- 806 Longacre Ct