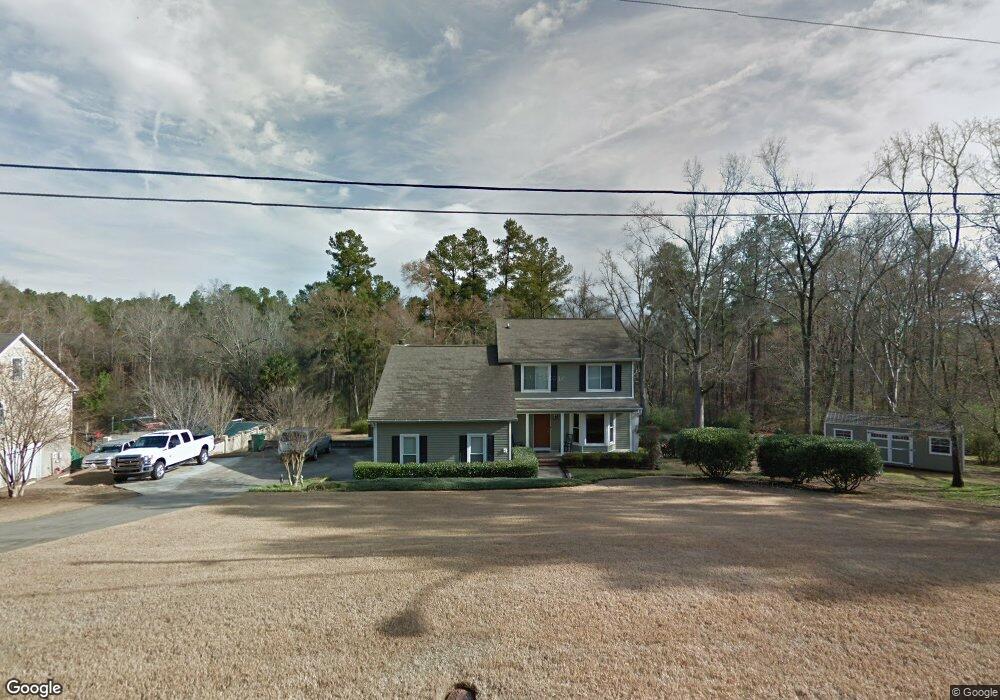
711 Riverbend Dr Augusta, GA 30907
Estimated Value: $340,988 - $401,000
3
Beds
2
Baths
2,351
Sq Ft
$155/Sq Ft
Est. Value
About This Home
This home is located at 711 Riverbend Dr, Augusta, GA 30907 and is currently estimated at $365,497, approximately $155 per square foot. 711 Riverbend Dr is a home located in Columbia County with nearby schools including Roosevelt Elementary School, Northmore Elementary School, and Stevens Creek Elementary School.
Ownership History
Date
Name
Owned For
Owner Type
Purchase Details
Closed on
Jan 5, 2021
Sold by
Sanders Michael A
Bought by
Powledge Hallie and Powledge Anthony
Current Estimated Value
Home Financials for this Owner
Home Financials are based on the most recent Mortgage that was taken out on this home.
Original Mortgage
$255,290
Outstanding Balance
$227,325
Interest Rate
2.71%
Mortgage Type
FHA
Estimated Equity
$138,172
Purchase Details
Closed on
Apr 14, 2006
Sold by
Sprouse Mary Louise
Bought by
Sanders Michael A
Create a Home Valuation Report for This Property
The Home Valuation Report is an in-depth analysis detailing your home's value as well as a comparison with similar homes in the area
Home Values in the Area
Average Home Value in this Area
Purchase History
| Date | Buyer | Sale Price | Title Company |
|---|---|---|---|
| Powledge Hallie | $260,000 | -- | |
| Sanders Michael A | $9,600 | -- |
Source: Public Records
Mortgage History
| Date | Status | Borrower | Loan Amount |
|---|---|---|---|
| Open | Powledge Hallie | $255,290 |
Source: Public Records
Tax History Compared to Growth
Tax History
| Year | Tax Paid | Tax Assessment Tax Assessment Total Assessment is a certain percentage of the fair market value that is determined by local assessors to be the total taxable value of land and additions on the property. | Land | Improvement |
|---|---|---|---|---|
| 2025 | $3,038 | $124,949 | $16,226 | $108,723 |
| 2024 | $2,809 | $110,079 | $16,226 | $93,853 |
| 2023 | $2,809 | $106,518 | $16,226 | $90,292 |
| 2022 | $2,560 | $96,261 | $16,226 | $80,035 |
| 2021 | $2,359 | $86,553 | $15,323 | $71,230 |
| 2020 | $2,366 | $85,043 | $15,143 | $69,900 |
| 2019 | $2,384 | $85,706 | $15,052 | $70,654 |
| 2018 | $2,092 | $74,902 | $15,052 | $59,850 |
| 2017 | $2,095 | $74,755 | $15,052 | $59,703 |
| 2016 | $1,933 | $71,503 | $13,743 | $57,760 |
| 2015 | $1,867 | $68,945 | $13,743 | $55,202 |
| 2014 | $2,026 | $73,940 | $11,396 | $62,544 |
Source: Public Records
Map
Nearby Homes
- 4020 Firethorn Ct
- 519 Seminole Place
- 615 Saw Grass Dr
- 3666 Bay Point
- 619 Baytree Ct
- 694 Woodhall Abbey Ct
- 615 Baytree Ct
- 1212 Arcilla Pointe
- 5214 Teal Ln
- 3810 Inverness Way
- 3710 Inverness Way
- 0 Osprey Ln Unit 546209
- 4110 Heritage Ridge
- 798 Osprey Ln
- 3812 Forest Creek Way
- 7304 Malton Ct
- 116 Hornsby Ln
- 507 Meldon Rd
- 3829 Villa Ln
- 2049 Egret Cir
- 704 Riverbend Dr
- 715 Riverbend Dr
- 720 Riverbend Dr
- 719 Riverbend Dr
- 702 Riverbend Dr
- 701 Riverbend Dr
- 723 Riverbend Dr
- 3815 Evans To Locks Rd
- 728 Riverbend Dr
- 725 Riverbend Dr
- 3783 Evans To Locks Rd
- 727 Riverbend Dr
- 729 Riverbend Dr
- 3781 Evans To Locks Rd
- 731 Riverbend Dr
- 3970 Blackstone Camp Rd
- 733 Riverbend Dr
- 3779 Evans To Locks Rd
- 3835 Evans To Locks Rd
- 3974 Blackstone Camp Rd