Estimated Value: $608,386 - $631,000
4
Beds
3
Baths
2,173
Sq Ft
$287/Sq Ft
Est. Value
About This Home
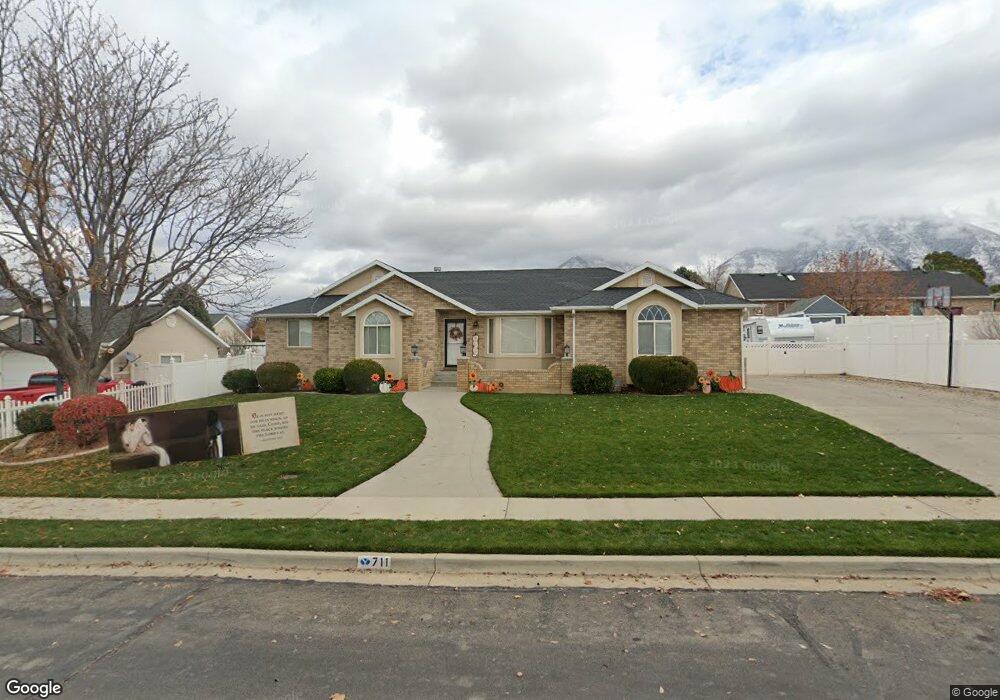
This home is located at 711 S 40 E, Salem, UT 84653 and is currently estimated at $622,795, approximately $286 per square foot. 711 S 40 E is a home located in Utah County with nearby schools including Mt. Loafer Elementary School, Valley View Middle School, and Salem Junior High School.
Ownership History
Date
Name
Owned For
Owner Type
Purchase Details
Closed on
Jun 15, 2020
Sold by
Lemon Paul A and Lemon Melinda A
Bought by
Lemon Paul Lee and Lemon Melinda Ann
Current Estimated Value
Purchase Details
Closed on
May 24, 1996
Sold by
Lemon Paul and Lemon Mindy
Bought by
Lemon Paul L and Lemon Melinda A
Home Financials for this Owner
Home Financials are based on the most recent Mortgage that was taken out on this home.
Original Mortgage
$141,300
Outstanding Balance
$8,103
Interest Rate
8.07%
Estimated Equity
$614,692
Purchase Details
Closed on
May 9, 1996
Sold by
Robert Nelson Construction L L C
Bought by
Lemon Paul and Lemon Mindy
Home Financials for this Owner
Home Financials are based on the most recent Mortgage that was taken out on this home.
Original Mortgage
$141,300
Outstanding Balance
$8,103
Interest Rate
8.07%
Estimated Equity
$614,692
Create a Home Valuation Report for This Property
The Home Valuation Report is an in-depth analysis detailing your home's value as well as a comparison with similar homes in the area
Home Values in the Area
Average Home Value in this Area
Purchase History
| Date | Buyer | Sale Price | Title Company |
|---|---|---|---|
| Lemon Paul Lee | -- | Meridian Title Company | |
| Lemon Paul L | -- | -- | |
| Lemon Paul | -- | -- |
Source: Public Records
Mortgage History
| Date | Status | Borrower | Loan Amount |
|---|---|---|---|
| Open | Lemon Paul L | $141,300 | |
| Closed | Lemon Paul | $135,630 |
Source: Public Records
Tax History
| Year | Tax Paid | Tax Assessment Tax Assessment Total Assessment is a certain percentage of the fair market value that is determined by local assessors to be the total taxable value of land and additions on the property. | Land | Improvement |
|---|---|---|---|---|
| 2025 | $2,832 | $297,605 | -- | -- |
| 2024 | $2,832 | $287,265 | $0 | $0 |
| 2023 | $2,850 | $289,520 | $0 | $0 |
| 2022 | $3,102 | $310,310 | $0 | $0 |
| 2021 | $2,555 | $410,100 | $103,500 | $306,600 |
| 2020 | $2,454 | $383,300 | $94,100 | $289,200 |
| 2019 | $2,144 | $342,000 | $90,500 | $251,500 |
| 2018 | $2,073 | $316,000 | $79,600 | $236,400 |
| 2017 | $2,089 | $169,840 | $0 | $0 |
| 2016 | $1,990 | $159,885 | $0 | $0 |
| 2015 | $1,890 | $149,160 | $0 | $0 |
| 2014 | $1,700 | $134,365 | $0 | $0 |
Source: Public Records
Map
Nearby Homes
- 481 W 705 S Unit 2
- 567 S Hazel Dr
- 1342 S 140 E Unit 11
- 1346 S 140 E Unit 10
- 173 W 650 S Unit 10
- 412 S 100 E
- 243 E 960 S Unit 216
- 245 E 960 S Unit 215
- 390 S Salem Lake Dr
- 1146 S 50 E
- 797 S 500 E Unit 12
- 1171 S 50 E
- 1197 S 120 E
- 309 1050 S Unit LUCAS
- 309 1050 S Unit MORGAN
- 309 1050 S Unit HARMON
- 309 1050 S Unit CALDWE
- 309 1050 S Unit BAXTER
- 309 1050 S Unit MORRIS
- 309 1050 S Unit MELROS
Your Personal Tour Guide
Ask me questions while you tour the home.