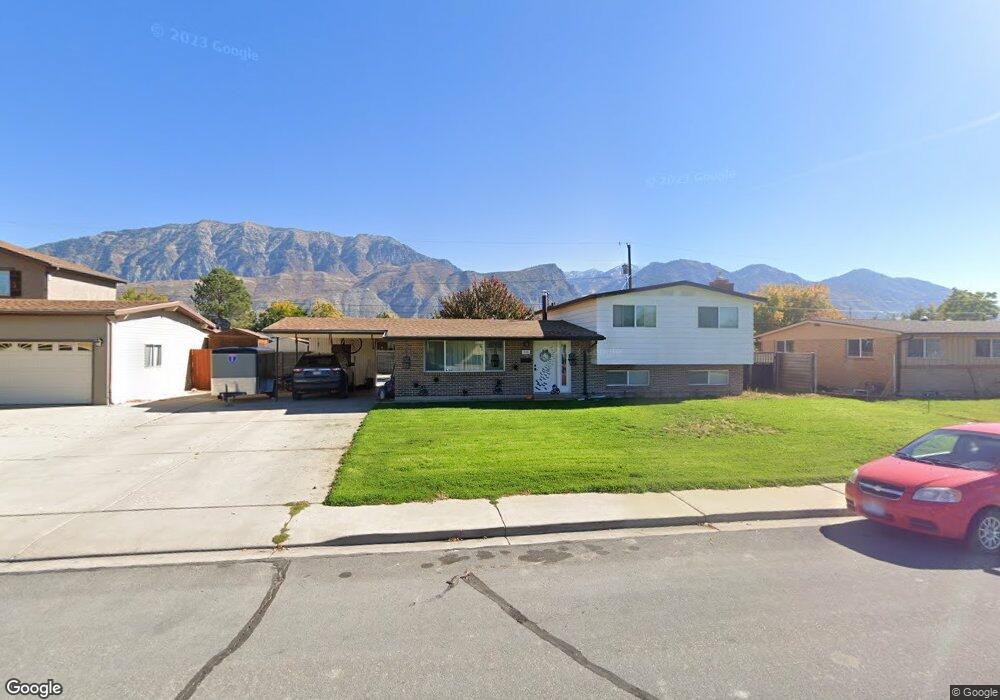
711 S 630 E Orem, UT 84097
SCERA NeighborhoodEstimated Value: $471,000 - $551,000
5
Beds
3
Baths
2,344
Sq Ft
$215/Sq Ft
Est. Value
About This Home
This home is located at 711 S 630 E, Orem, UT 84097 and is currently estimated at $504,483, approximately $215 per square foot. 711 S 630 E is a home located in Utah County with nearby schools including Centennial Elementary, Lakeridge Jr High School, and Orem High School.
Ownership History
Date
Name
Owned For
Owner Type
Purchase Details
Closed on
Jun 29, 2016
Sold by
Barnes R Jason
Bought by
Barnes R Jason and Barnes Erin
Current Estimated Value
Home Financials for this Owner
Home Financials are based on the most recent Mortgage that was taken out on this home.
Original Mortgage
$187,600
Outstanding Balance
$149,761
Interest Rate
3.58%
Mortgage Type
New Conventional
Estimated Equity
$354,722
Purchase Details
Closed on
Jun 26, 2013
Sold by
Barker Shane R
Bought by
Barnes R Jason and Barnes Erin M
Home Financials for this Owner
Home Financials are based on the most recent Mortgage that was taken out on this home.
Original Mortgage
$192,035
Interest Rate
3.75%
Mortgage Type
FHA
Create a Home Valuation Report for This Property
The Home Valuation Report is an in-depth analysis detailing your home's value as well as a comparison with similar homes in the area
Home Values in the Area
Average Home Value in this Area
Purchase History
| Date | Buyer | Sale Price | Title Company |
|---|---|---|---|
| Barnes R Jason | -- | Old Republic Title | |
| Barnes R Jason | -- | Affiliated First Title Co |
Source: Public Records
Mortgage History
| Date | Status | Borrower | Loan Amount |
|---|---|---|---|
| Open | Barnes R Jason | $187,600 | |
| Previous Owner | Barnes R Jason | $192,035 |
Source: Public Records
Tax History
| Year | Tax Paid | Tax Assessment Tax Assessment Total Assessment is a certain percentage of the fair market value that is determined by local assessors to be the total taxable value of land and additions on the property. | Land | Improvement |
|---|---|---|---|---|
| 2025 | $1,944 | $239,195 | -- | -- |
| 2024 | $1,944 | $237,655 | $0 | $0 |
| 2023 | $1,813 | $238,315 | $0 | $0 |
| 2022 | $1,751 | $222,970 | $0 | $0 |
| 2021 | $1,633 | $314,900 | $128,600 | $186,300 |
| 2020 | $1,506 | $285,500 | $102,900 | $182,600 |
| 2019 | $1,371 | $270,200 | $96,000 | $174,200 |
| 2018 | $1,323 | $249,200 | $92,600 | $156,600 |
| 2017 | $1,265 | $127,600 | $0 | $0 |
| 2016 | $1,201 | $111,705 | $0 | $0 |
| 2015 | $1,221 | $107,415 | $0 | $0 |
| 2014 | $1,178 | $103,180 | $0 | $0 |
Source: Public Records
Map
Nearby Homes
Your Personal Tour Guide
Ask me questions while you tour the home.