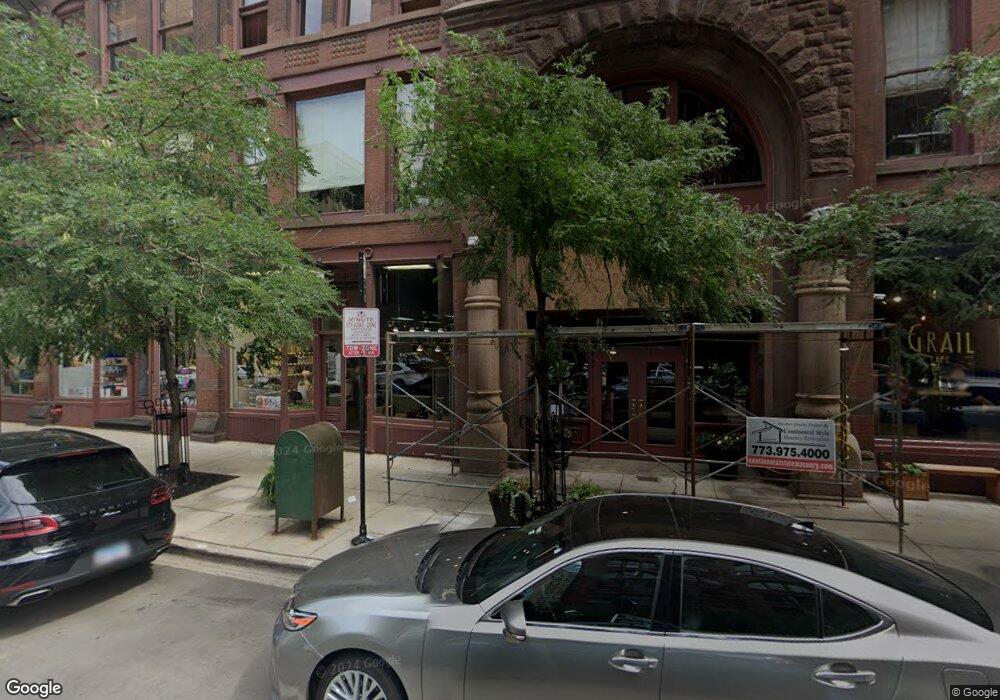
711 S Dearborn St Unit 723 Chicago, IL 60605
Printers Row NeighborhoodEstimated Value: $303,000 - $404,000
--
Bed
--
Bath
43,400
Sq Ft
$8/Sq Ft
Est. Value
About This Home
This home is located at 711 S Dearborn St Unit 723, Chicago, IL 60605 and is currently estimated at $345,163, approximately $7 per square foot. 711 S Dearborn St Unit 723 is a home located in Cook County with nearby schools including South Loop Elementary School, Wendell Phillips Academy High School, and Chicago International Charter School.
Ownership History
Date
Name
Owned For
Owner Type
Purchase Details
Closed on
May 27, 2022
Sold by
Swift Christine
Bought by
Equity Trust Company and James Shelds Ira
Current Estimated Value
Purchase Details
Closed on
Oct 17, 2021
Sold by
Ormond Mark R
Bought by
Ormond Mark R and Swift Christine
Purchase Details
Closed on
Apr 16, 2019
Sold by
County Of Cook
Bought by
Bogo Llc
Purchase Details
Closed on
Aug 9, 2011
Sold by
Pedelty Lori K and Ormond Mark R
Bought by
Ormond Mark R
Purchase Details
Closed on
Jun 10, 1998
Sold by
Lasalle National Bank
Bought by
Ormond Mark and Pedelty Lori
Home Financials for this Owner
Home Financials are based on the most recent Mortgage that was taken out on this home.
Original Mortgage
$116,000
Interest Rate
7.22%
Create a Home Valuation Report for This Property
The Home Valuation Report is an in-depth analysis detailing your home's value as well as a comparison with similar homes in the area
Home Values in the Area
Average Home Value in this Area
Purchase History
| Date | Buyer | Sale Price | Title Company |
|---|---|---|---|
| Equity Trust Company | $250,000 | Blumenthal Jeffrey 5 | |
| Ormond Mark R | -- | None Available | |
| Bogo Llc | -- | None Available | |
| Ormond Mark R | -- | None Available | |
| Ormond Mark | $145,000 | Ticor Title Insurance |
Source: Public Records
Mortgage History
| Date | Status | Borrower | Loan Amount |
|---|---|---|---|
| Previous Owner | Ormond Mark | $116,000 |
Source: Public Records
Tax History Compared to Growth
Tax History
| Year | Tax Paid | Tax Assessment Tax Assessment Total Assessment is a certain percentage of the fair market value that is determined by local assessors to be the total taxable value of land and additions on the property. | Land | Improvement |
|---|---|---|---|---|
| 2024 | $5,907 | $31,419 | $3,266 | $28,153 |
| 2023 | $5,055 | $28,000 | $2,845 | $25,155 |
| 2022 | $5,055 | $28,000 | $2,845 | $25,155 |
| 2021 | $4,961 | $27,999 | $2,844 | $25,155 |
| 2020 | $4,926 | $25,215 | $2,385 | $22,830 |
| 2019 | $4,829 | $27,463 | $2,385 | $25,078 |
| 2018 | $4,746 | $27,463 | $2,385 | $25,078 |
| 2017 | $5,238 | $24,334 | $1,974 | $22,360 |
| 2016 | $4,874 | $24,334 | $1,974 | $22,360 |
| 2015 | $4,459 | $24,334 | $1,974 | $22,360 |
| 2014 | $4,130 | $22,258 | $1,818 | $20,440 |
| 2013 | $4,048 | $22,258 | $1,818 | $20,440 |
Source: Public Records
Map
Nearby Homes
- 727 S Dearborn St Unit 311
- 633 S Plymouth Ct Unit 1009
- 633 S Plymouth Ct Unit 607
- 740 S Federal St Unit 1109
- 740 S Federal St Unit 301
- 740 S Federal St Unit 1204
- 780 S Federal St Unit 902
- 780 S Federal St Unit 1202
- 780 S Federal St Unit 606
- 780 S Federal St Unit 310
- 680 S Federal St Unit 903
- 600 S Dearborn St Unit 1602
- 600 S Dearborn St Unit 1007
- 600 S Dearborn St Unit 1901
- 801 S Plymouth Ct Unit 801
- 801 S Plymouth Ct Unit 302
- 801 S Plymouth Ct Unit 809
- 124 W Polk St Unit 707
- 124 W Polk St Unit 100
- 124 W Polk St Unit 101
- 711 S Dearborn St Unit 802
- 711 S Dearborn St Unit 803
- 727 S Dearborn St Unit 613
- 711 S Dearborn St Unit 808
- 711 S Dearborn St Unit 8A
- 711 S Dearborn St Unit 8F1
- 711 S Dearborn St Unit 5D
- 711 S Dearborn St Unit 7D
- 711 S Dearborn St Unit 2E
- 711 S Dearborn St Unit 701J
- 711 S Dearborn St Unit 701I
- 711 S Dearborn St Unit 8C1
- 711 S Dearborn St Unit 3F1
- 711 S Dearborn St Unit 719W
- 711 S Dearborn St Unit 701K
- 711 S Dearborn St Unit 701F
- 711 S Dearborn St Unit 701C
- 711 S Dearborn St Unit 701B
- 711 S Dearborn St Unit 701A
- 711 S Dearborn St Unit 507