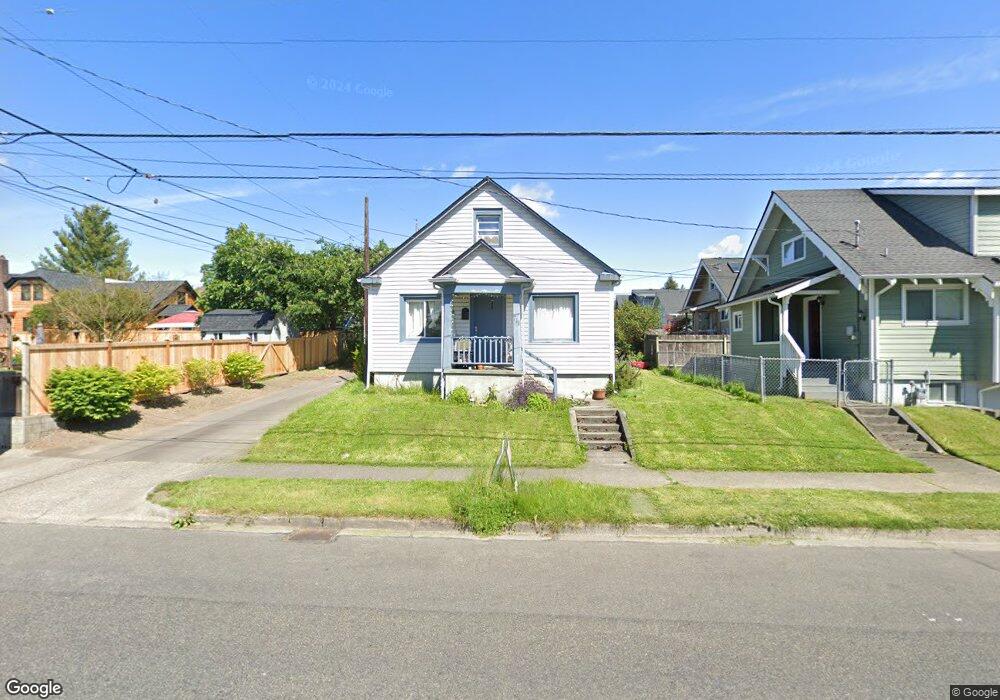
711 S Proctor St Unit 98405 Tacoma, WA 98405
Central Tacoma NeighborhoodEstimated Value: $430,000 - $451,000
4
Beds
1
Bath
1,224
Sq Ft
$357/Sq Ft
Est. Value
About This Home
This home is located at 711 S Proctor St Unit 98405, Tacoma, WA 98405 and is currently estimated at $436,756, approximately $356 per square foot. 711 S Proctor St Unit 98405 is a home located in Pierce County with nearby schools including Franklin Elementary School, Mason Middle School, and Foss High School.
Ownership History
Date
Name
Owned For
Owner Type
Purchase Details
Closed on
Jan 11, 2019
Sold by
Singh Gina
Bought by
Loughlin Jean Ann O
Current Estimated Value
Home Financials for this Owner
Home Financials are based on the most recent Mortgage that was taken out on this home.
Original Mortgage
$202,000
Outstanding Balance
$129,367
Interest Rate
4.7%
Mortgage Type
New Conventional
Estimated Equity
$307,389
Purchase Details
Closed on
Mar 14, 2017
Sold by
Singh Gina
Bought by
Singh Gina
Purchase Details
Closed on
Jun 1, 2004
Sold by
Nicol Robert and Nicol Diane K
Bought by
Singh Christopher Chiranjiv and Singh Gina L
Home Financials for this Owner
Home Financials are based on the most recent Mortgage that was taken out on this home.
Original Mortgage
$110,400
Interest Rate
4.32%
Mortgage Type
Purchase Money Mortgage
Purchase Details
Closed on
Jul 5, 1996
Sold by
Overton Thomas R and Overton Sheryl A
Bought by
Nicol Robert and Nicol Diane K
Create a Home Valuation Report for This Property
The Home Valuation Report is an in-depth analysis detailing your home's value as well as a comparison with similar homes in the area
Home Values in the Area
Average Home Value in this Area
Purchase History
| Date | Buyer | Sale Price | Title Company |
|---|---|---|---|
| Loughlin Jean Ann O | $252,500 | Wfg National Title Insurance | |
| Singh Gina | -- | None Available | |
| Singh Christopher Chiranjiv | -- | Fidelity National Title Co | |
| Singh Chiranjiv | $138,000 | Fidelity National Title Co | |
| Nicol Robert | $95,398 | Rainier Title Company |
Source: Public Records
Mortgage History
| Date | Status | Borrower | Loan Amount |
|---|---|---|---|
| Open | Loughlin Jean Ann O | $202,000 | |
| Previous Owner | Singh Chiranjiv | $110,400 |
Source: Public Records
Tax History Compared to Growth
Tax History
| Year | Tax Paid | Tax Assessment Tax Assessment Total Assessment is a certain percentage of the fair market value that is determined by local assessors to be the total taxable value of land and additions on the property. | Land | Improvement |
|---|---|---|---|---|
| 2025 | $3,766 | $356,000 | $212,400 | $143,600 |
| 2024 | $3,766 | $355,600 | $204,700 | $150,900 |
| 2023 | $3,766 | $338,000 | $197,000 | $141,000 |
| 2022 | $3,273 | $334,000 | $177,300 | $156,700 |
| 2021 | $3,049 | $242,300 | $112,700 | $129,600 |
| 2019 | $2,598 | $222,800 | $95,300 | $127,500 |
| 2018 | $2,662 | $199,600 | $83,500 | $116,100 |
| 2017 | $2,342 | $168,300 | $61,000 | $107,300 |
| 2016 | $2,057 | $127,500 | $44,500 | $83,000 |
| 2014 | $1,870 | $118,200 | $39,000 | $79,200 |
| 2013 | $1,870 | $107,900 | $36,700 | $71,200 |
Source: Public Records
Map
Nearby Homes
- 819 S Adams St
- 4118 S 7th St
- 3822 N 8th St
- 1002 S Washington St
- 4119 6th Ave
- 3816 S 11th St
- 1026 S Monroe St
- 3824 S 12th St
- 3820 S 12th St
- 716 S Puget Sound Ave
- 3501 6th Ave
- 3517 S 11th St
- 4111 N 9th St
- 3606 S 12th St
- 1301 S Durango St
- 1246 S Durango St
- 4312 N 9th St
- 1231 S Washington St
- 4415 S 10th St
- 3417 S 12th St