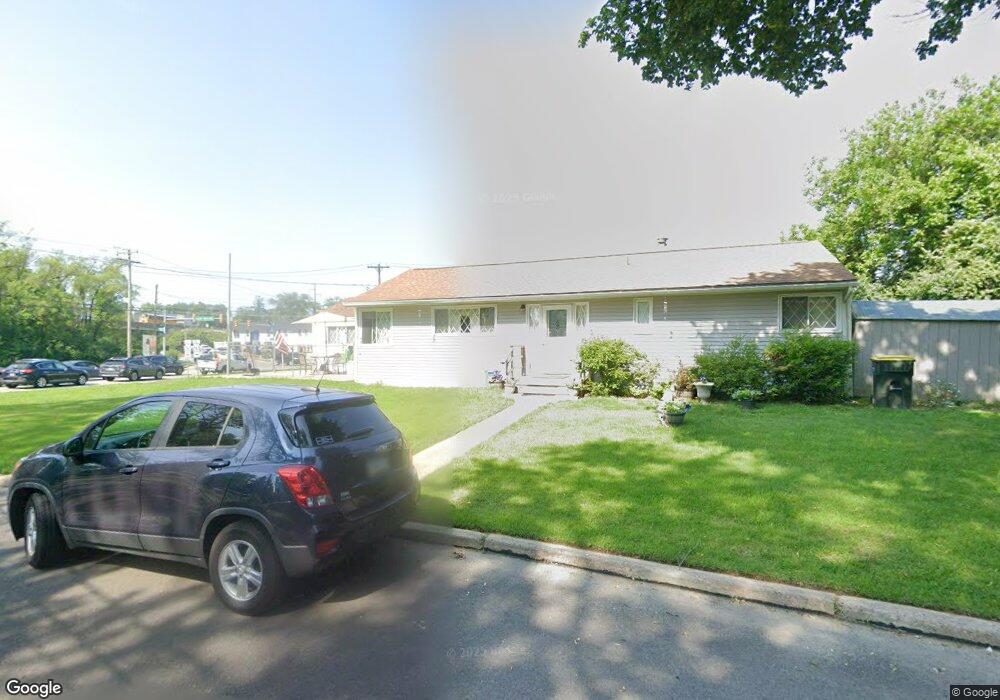
711 S York Rd Hatboro, PA 19040
Estimated Value: $294,000 - $432,000
3
Beds
1
Bath
1,512
Sq Ft
$246/Sq Ft
Est. Value
About This Home
This home is located at 711 S York Rd, Hatboro, PA 19040 and is currently estimated at $371,902, approximately $245 per square foot. 711 S York Rd is a home located in Montgomery County with nearby schools including Upper Moreland Intermediate School, Upper Moreland Primary School, and Upper Moreland Middle School.
Ownership History
Date
Name
Owned For
Owner Type
Purchase Details
Closed on
Jul 19, 2007
Sold by
Polichtchouk Mykola
Bought by
Smith Madeline T and Edwards Kenneth Wayne
Current Estimated Value
Home Financials for this Owner
Home Financials are based on the most recent Mortgage that was taken out on this home.
Original Mortgage
$218,176
Outstanding Balance
$137,997
Interest Rate
6.73%
Estimated Equity
$233,905
Purchase Details
Closed on
Oct 31, 2003
Sold by
United Sa Sec Housin & Urban Dev
Bought by
Polichtchouk Mykola
Purchase Details
Closed on
May 30, 2003
Sold by
Wells Fargo Home Mort Inc
Bought by
United Sa Sec Housing & Urban Dev
Purchase Details
Closed on
Jan 6, 2003
Sold by
Hauser David J
Bought by
Wells Fargo Home Mortgage Inc and Norwest Mortgage Inc
Purchase Details
Closed on
Mar 1, 1999
Sold by
Zoller Regina
Bought by
Hauser David J
Create a Home Valuation Report for This Property
The Home Valuation Report is an in-depth analysis detailing your home's value as well as a comparison with similar homes in the area
Home Values in the Area
Average Home Value in this Area
Purchase History
| Date | Buyer | Sale Price | Title Company |
|---|---|---|---|
| Smith Madeline T | $219,900 | None Available | |
| Polichtchouk Mykola | $72,971 | -- | |
| United Sa Sec Housing & Urban Dev | -- | -- | |
| Wells Fargo Home Mortgage Inc | $1,642 | -- | |
| Hauser David J | $85,000 | -- |
Source: Public Records
Mortgage History
| Date | Status | Borrower | Loan Amount |
|---|---|---|---|
| Open | Smith Madeline T | $218,176 |
Source: Public Records
Tax History Compared to Growth
Tax History
| Year | Tax Paid | Tax Assessment Tax Assessment Total Assessment is a certain percentage of the fair market value that is determined by local assessors to be the total taxable value of land and additions on the property. | Land | Improvement |
|---|---|---|---|---|
| 2025 | $4,873 | $102,510 | -- | -- |
| 2024 | $4,873 | $102,510 | -- | -- |
| 2023 | $4,670 | $102,510 | $0 | $0 |
| 2022 | $4,392 | $102,510 | $0 | $0 |
| 2021 | $4,333 | $102,510 | $0 | $0 |
| 2020 | $4,190 | $102,510 | $0 | $0 |
| 2019 | $4,098 | $102,510 | $0 | $0 |
| 2018 | $4,098 | $102,510 | $0 | $0 |
| 2017 | $3,915 | $102,510 | $0 | $0 |
| 2016 | $3,875 | $102,510 | $0 | $0 |
| 2015 | $3,787 | $102,510 | $0 | $0 |
| 2014 | $3,677 | $102,510 | $0 | $0 |
Source: Public Records
Map
Nearby Homes
- 69 Crooked Billet Rd
- 160 Crooked Billet Rd
- 1104 N York Rd
- 315 Arionne Dr
- 11 Jessop Ln
- 1014 N York Rd
- 423 Moreboro Rd
- 36 Jessop Ln
- 1006 N York Rd Unit 1
- 438 Moreboro Rd
- 40 W Lehman Ave
- 612 Brook St
- 885 N York Rd Unit 12C
- 1708 Magnolia Ave
- 605 Fairhill St
- 14 Knock N Knoll Cir Unit L-14
- 112 Byberry Rd Unit 2
- 712 N York Rd
- 505 Crown St
- 3898 Round Meadow Ln
- 709 S York Rd
- 712 S York Rd
- 615 S Warminster Rd
- 608 S Warminster Rd
- 710 S York Rd
- 708 S York Rd
- 705 S York Rd
- 10 S Warminster Rd
- 606 S Warminster Rd
- 800 S York Rd
- 706 S York Rd
- 707 Burbridge Rd
- 3101 W Mill Rd
- 703 S York Rd
- 812 S York Rd
- 704 S York Rd
- 103 Lancaster Place
- 4 Armour Rd
- 10 Armour Rd
- 8 Armour Rd