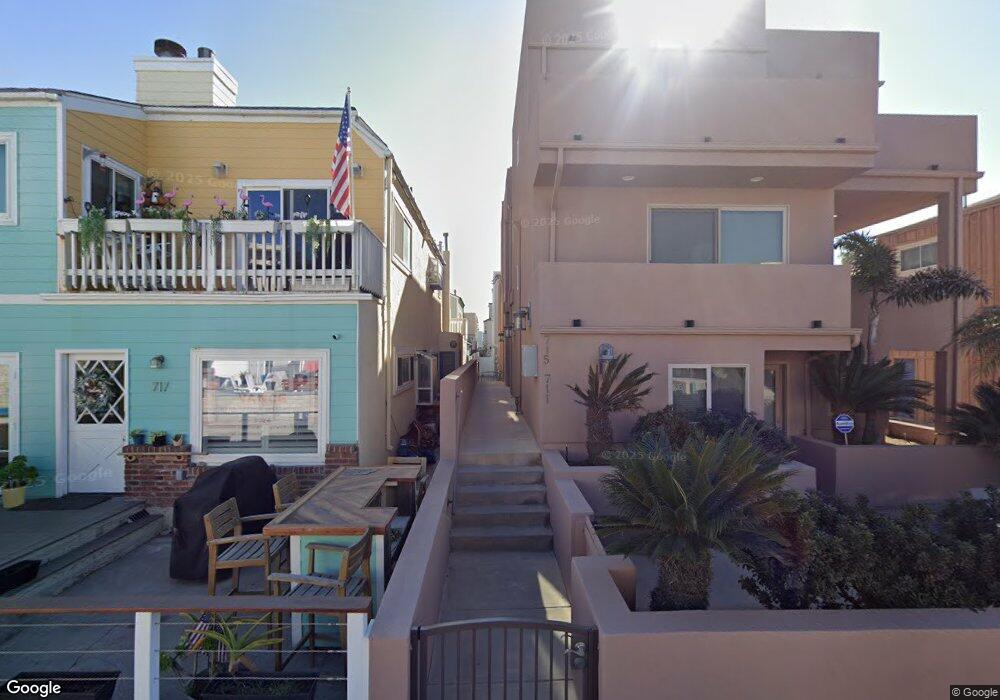
711 San Gabriel Place Unit 1 San Diego, CA 92109
Mission Beach NeighborhoodEstimated Value: $1,902,000 - $2,841,000
3
Beds
3
Baths
1,383
Sq Ft
$1,621/Sq Ft
Est. Value
About This Home
This home is located at 711 San Gabriel Place Unit 1, San Diego, CA 92109 and is currently estimated at $2,242,284, approximately $1,621 per square foot. 711 San Gabriel Place Unit 1 is a home located in San Diego County with nearby schools including Pacific Beach Elementary School, Pacific Beach Middle, and Mission Bay High School.
Ownership History
Date
Name
Owned For
Owner Type
Purchase Details
Closed on
Dec 9, 2020
Sold by
Kassem Omar
Bought by
Kassem Omar and Omar Kassem 2020 Revocable Tru
Current Estimated Value
Purchase Details
Closed on
Nov 20, 2015
Sold by
Hering Paul Jeffrey and Hering Susan Lucyle
Bought by
Kassem Omar
Home Financials for this Owner
Home Financials are based on the most recent Mortgage that was taken out on this home.
Original Mortgage
$1,081,800
Outstanding Balance
$848,568
Interest Rate
3.71%
Mortgage Type
New Conventional
Estimated Equity
$1,393,716
Purchase Details
Closed on
Nov 1, 2010
Sold by
Hering Paul J and Hering Susan L
Bought by
Hering Paul Jeffrey and Hering Susan Lucyle
Home Financials for this Owner
Home Financials are based on the most recent Mortgage that was taken out on this home.
Original Mortgage
$625,500
Interest Rate
4.27%
Mortgage Type
New Conventional
Purchase Details
Closed on
Oct 10, 2006
Sold by
Sunset Surf Llc
Bought by
Hering Paul J and Hering Susan L
Home Financials for this Owner
Home Financials are based on the most recent Mortgage that was taken out on this home.
Original Mortgage
$975,000
Interest Rate
6.36%
Mortgage Type
Unknown
Create a Home Valuation Report for This Property
The Home Valuation Report is an in-depth analysis detailing your home's value as well as a comparison with similar homes in the area
Home Values in the Area
Average Home Value in this Area
Purchase History
| Date | Buyer | Sale Price | Title Company |
|---|---|---|---|
| Kassem Omar | -- | None Available | |
| Kassem Omar | $1,352,500 | Chicago Title Company Sd | |
| Hering Paul Jeffrey | -- | Chicago Title Company | |
| Hering Paul J | $1,300,000 | Landamerica |
Source: Public Records
Mortgage History
| Date | Status | Borrower | Loan Amount |
|---|---|---|---|
| Open | Kassem Omar | $1,081,800 | |
| Previous Owner | Hering Paul Jeffrey | $625,500 | |
| Previous Owner | Hering Paul J | $975,000 |
Source: Public Records
Tax History Compared to Growth
Tax History
| Year | Tax Paid | Tax Assessment Tax Assessment Total Assessment is a certain percentage of the fair market value that is determined by local assessors to be the total taxable value of land and additions on the property. | Land | Improvement |
|---|---|---|---|---|
| 2025 | $19,317 | $1,600,783 | $1,242,984 | $357,799 |
| 2024 | $19,317 | $1,569,396 | $1,218,612 | $350,784 |
| 2023 | $18,891 | $1,538,624 | $1,194,718 | $343,906 |
| 2022 | $18,388 | $1,508,456 | $1,171,293 | $337,163 |
| 2021 | $18,262 | $1,478,879 | $1,148,327 | $330,552 |
| 2020 | $18,039 | $1,463,716 | $1,136,553 | $327,163 |
| 2019 | $17,718 | $1,435,017 | $1,114,268 | $320,749 |
| 2018 | $16,563 | $1,406,880 | $1,092,420 | $314,460 |
| 2017 | $80 | $1,379,295 | $1,071,000 | $308,295 |
| 2016 | $15,921 | $1,352,250 | $1,050,000 | $302,250 |
| 2015 | $14,137 | $1,200,000 | $867,000 | $333,000 |
| 2014 | $11,239 | $950,000 | $687,000 | $263,000 |
Source: Public Records
Map
Nearby Homes
- 2820 Bayside Walk Unit 2
- 2808 Bayside Walk Unit B
- 2965 Mission Blvd Unit 4C
- 808 Ensenada Ct
- 2999 Mission Blvd Unit 201
- 2740 Ocean Front Walk
- 2735 Mission Blvd
- 2727 Ocean Front Walk Unit 3
- 722 San Luis Rey Place Unit 24
- 817 San Luis Rey Place
- 801 Allerton Ct
- 2623 Ocean Front Walk
- 2617 Ocean Front Walk
- 2632 Bayside Walk
- 717 Island Ct
- 728 Jamaica Ct
- 3286-88 Bayside Walk
- 3291 Bayside Walk
- 810 Santa Barbara Place
- 735 Jersey Ct
- 715 San Gabriel Place Unit 2
- 717 San Gabriel Place Unit L1
- 719 San Gabriel Place Unit L2
- 725 San Gabriel Place
- 723 San Gabriel Place
- 2889 Ocean Front Walk
- 2887 Ocean Front Walk
- 714 Deal Ct
- 729 San Gabriel Place
- 727 San Gabriel Place
- 714 San Gabriel Place
- 2881 Ocean Front Walk Unit 83
- 718 Deal Ct
- 718 San Gabriel Place Unit 20
- 722 Deal Ct
- 2907 Ocean Front Walk
- 2905 Ocean Front Walk
- 2873 Ocean Front Walk Unit 79
- 716 San Gabriel Place
- 710 San Gabriel Place