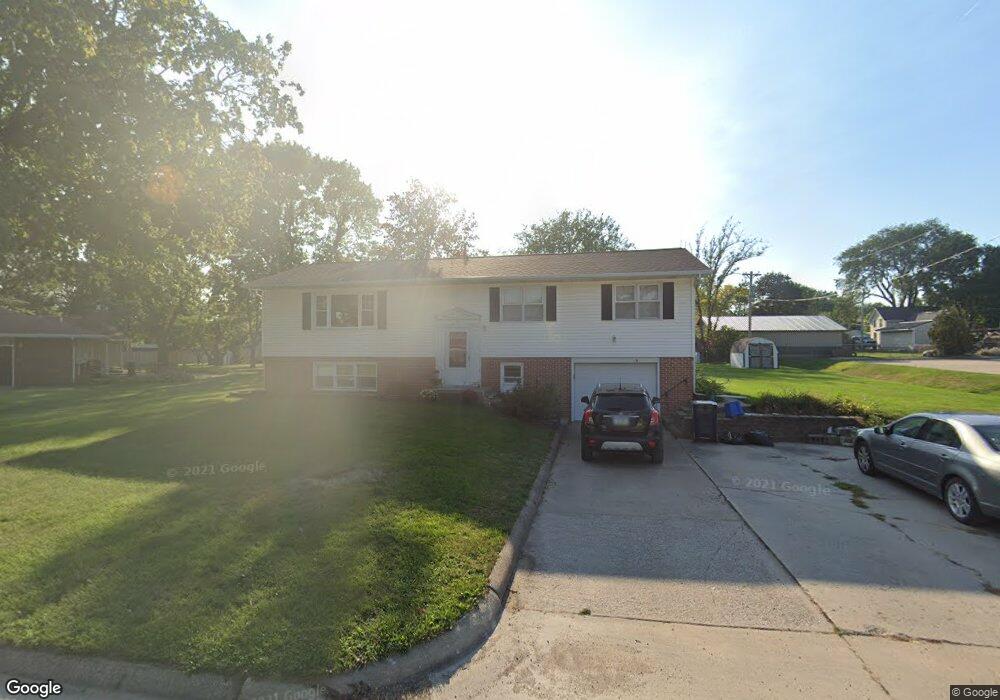
711 Sycamore St Wilton, IA 52778
Estimated Value: $223,658 - $274,000
3
Beds
3
Baths
1,352
Sq Ft
$179/Sq Ft
Est. Value
About This Home
This home is located at 711 Sycamore St, Wilton, IA 52778 and is currently estimated at $242,415, approximately $179 per square foot. 711 Sycamore St is a home with nearby schools including Wilton Elementary School and Wilton Junior/Senior High School.
Ownership History
Date
Name
Owned For
Owner Type
Purchase Details
Closed on
May 6, 2005
Sold by
Carlson Robert Junior and Carlson Robert J
Bought by
Drumm Jeffrey P and Drumm Jeananne M
Current Estimated Value
Home Financials for this Owner
Home Financials are based on the most recent Mortgage that was taken out on this home.
Original Mortgage
$126,000
Outstanding Balance
$66,917
Interest Rate
6.13%
Mortgage Type
New Conventional
Estimated Equity
$175,498
Create a Home Valuation Report for This Property
The Home Valuation Report is an in-depth analysis detailing your home's value as well as a comparison with similar homes in the area
Home Values in the Area
Average Home Value in this Area
Purchase History
| Date | Buyer | Sale Price | Title Company |
|---|---|---|---|
| Drumm Jeffrey P | $128,000 | None Available |
Source: Public Records
Mortgage History
| Date | Status | Borrower | Loan Amount |
|---|---|---|---|
| Open | Drumm Jeffrey P | $126,000 |
Source: Public Records
Tax History Compared to Growth
Tax History
| Year | Tax Paid | Tax Assessment Tax Assessment Total Assessment is a certain percentage of the fair market value that is determined by local assessors to be the total taxable value of land and additions on the property. | Land | Improvement |
|---|---|---|---|---|
| 2025 | $3,344 | $206,540 | $43,980 | $162,560 |
| 2024 | $3,344 | $203,760 | $43,980 | $159,780 |
| 2023 | $3,208 | $205,047 | $44,001 | $161,046 |
| 2022 | $3,226 | $184,960 | $41,510 | $143,450 |
| 2021 | $3,226 | $172,790 | $41,510 | $131,280 |
| 2020 | $3,188 | $162,610 | $41,510 | $121,100 |
| 2019 | $3,150 | $153,000 | $0 | $0 |
| 2018 | $2,902 | $146,970 | $0 | $0 |
| 2017 | $2,902 | $146,970 | $0 | $0 |
| 2016 | $2,956 | $146,970 | $0 | $0 |
| 2015 | $2,956 | $143,060 | $0 | $0 |
| 2014 | $2,882 | $143,060 | $0 | $0 |
Source: Public Records
Map
Nearby Homes