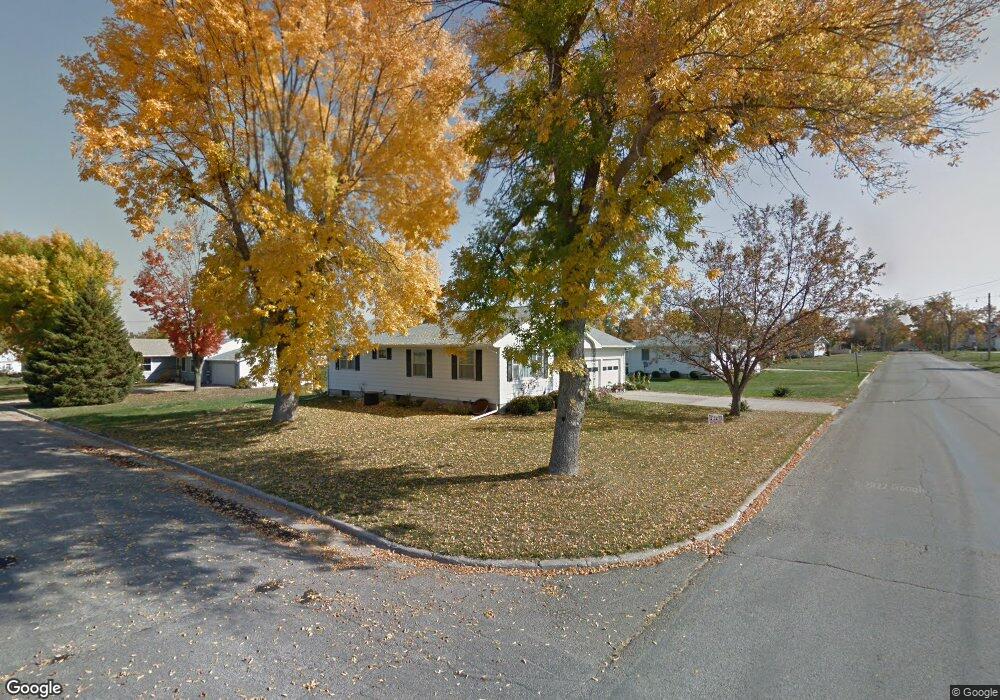
711 W 13th St Vinton, IA 52349
Estimated Value: $165,411 - $187,000
3
Beds
2
Baths
1,176
Sq Ft
$147/Sq Ft
Est. Value
About This Home
This home is located at 711 W 13th St, Vinton, IA 52349 and is currently estimated at $172,603, approximately $146 per square foot. 711 W 13th St is a home located in Benton County with nearby schools including Tilford Elementary School, Shellsburg Elementary School, and Vinton-Shellsburg Middle School.
Ownership History
Date
Name
Owned For
Owner Type
Purchase Details
Closed on
Jan 16, 2006
Sold by
Ellis Ethel L and Ellis Ethel Lucile
Bought by
Spece Wanita A
Current Estimated Value
Home Financials for this Owner
Home Financials are based on the most recent Mortgage that was taken out on this home.
Original Mortgage
$50,001
Outstanding Balance
$28,353
Interest Rate
6.42%
Mortgage Type
New Conventional
Estimated Equity
$144,250
Create a Home Valuation Report for This Property
The Home Valuation Report is an in-depth analysis detailing your home's value as well as a comparison with similar homes in the area
Home Values in the Area
Average Home Value in this Area
Purchase History
| Date | Buyer | Sale Price | Title Company |
|---|---|---|---|
| Spece Wanita A | $105,000 | None Available |
Source: Public Records
Mortgage History
| Date | Status | Borrower | Loan Amount |
|---|---|---|---|
| Open | Spece Wanita A | $50,001 |
Source: Public Records
Tax History Compared to Growth
Tax History
| Year | Tax Paid | Tax Assessment Tax Assessment Total Assessment is a certain percentage of the fair market value that is determined by local assessors to be the total taxable value of land and additions on the property. | Land | Improvement |
|---|---|---|---|---|
| 2025 | $1,990 | $146,700 | $26,200 | $120,500 |
| 2024 | $1,990 | $133,200 | $26,200 | $107,000 |
| 2023 | $2,068 | $133,200 | $26,200 | $107,000 |
| 2022 | $2,132 | $107,800 | $20,900 | $86,900 |
| 2021 | $2,132 | $107,800 | $20,900 | $86,900 |
| 2020 | $1,966 | $102,400 | $18,800 | $83,600 |
| 2019 | $1,876 | $102,400 | $18,800 | $83,600 |
| 2018 | $1,914 | $101,600 | $17,800 | $83,800 |
| 2017 | $1,760 | $101,600 | $17,800 | $83,800 |
| 2016 | $1,788 | $94,900 | $16,600 | $78,300 |
| 2015 | $1,788 | $94,900 | $16,600 | $78,300 |
| 2014 | $2,036 | $106,200 | $0 | $0 |
Source: Public Records
Map
Nearby Homes