
Landlord's Agent in 2025
Sam Massaed
Tower Realty Austin
(512) 963-9700
11 in this area
22 Total Sales
Estimated Value: $411,602 - $429,000
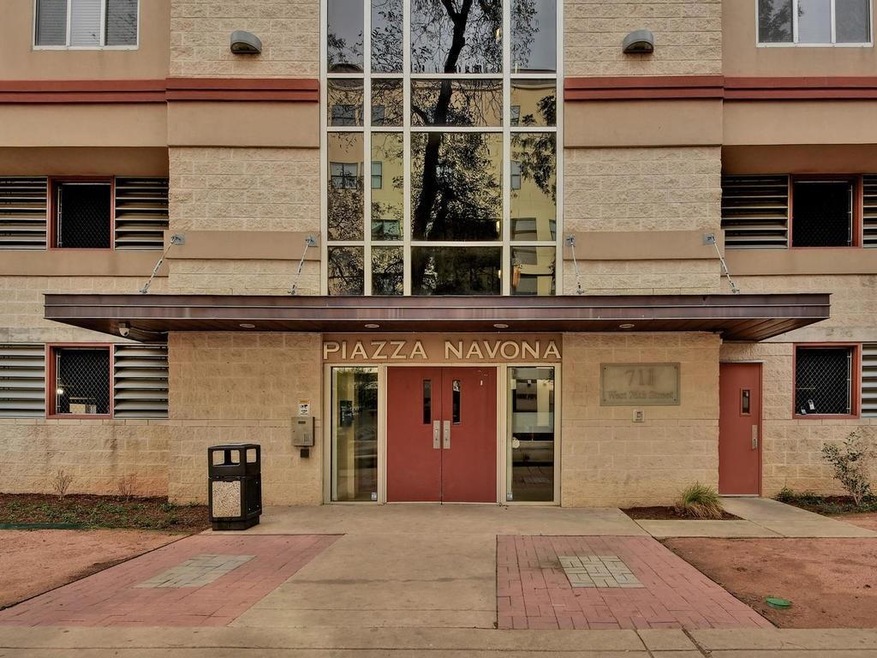
Experience the best living in this stunning 5th floor condo located in the highly desirable West Campus neighborhood. Piazza Navona is just a short 3-block walk from the University of Texas campus, offering unbeatable convenience for students and faculty alike. This spacious 2 bedroom, 2 bathroom unit features a perfectly designed roommate floor plan. The interior of this unit is just as impressive, with elegant touches such as granite countertops and wood flooring flooring throughout. Building has two elevators and two reserved parking spaces in the gated garage.
Last Agent to Rent the Property
Tower Realty Austin Brokerage Phone: (512) 478-9400 License #0440933 Listed on: 06/06/2025
| Date | Buyer | Sale Price | Title Company |
|---|---|---|---|
| Chatila Khaled | -- | None Available | |
| Wilkowski Grace W | -- | Itc | |
| Dean Chen Ventures Llc | -- | None Available |
| Date | Event | Price | List to Sale | Price per Sq Ft |
|---|---|---|---|---|
| 07/12/2025 07/12/25 | Rented | $2,195 | 0.0% | -- |
| 06/06/2025 06/06/25 | For Rent | $2,195 | 0.0% | -- |
| 06/19/2024 06/19/24 | Rented | $2,195 | 0.0% | -- |
| 06/03/2024 06/03/24 | Under Contract | -- | -- | -- |
| 05/01/2024 05/01/24 | Price Changed | $2,195 | -4.4% | $2 / Sq Ft |
| 02/18/2024 02/18/24 | For Rent | $2,295 | +14.8% | -- |
| 07/22/2021 07/22/21 | Rented | $2,000 | 0.0% | -- |
| 07/02/2021 07/02/21 | Under Contract | -- | -- | -- |
| 04/21/2021 04/21/21 | For Rent | $2,000 | -9.1% | -- |
| 02/14/2020 02/14/20 | Rented | $2,200 | 0.0% | -- |
| 10/11/2019 10/11/19 | For Rent | $2,200 | -- | -- |
| Year | Tax Paid | Tax Assessment Tax Assessment Total Assessment is a certain percentage of the fair market value that is determined by local assessors to be the total taxable value of land and additions on the property. | Land | Improvement |
|---|---|---|---|---|
| 2025 | $7,595 | $375,169 | $57,581 | $317,588 |
| 2023 | $7,595 | $367,491 | $57,581 | $309,910 |
| 2022 | $7,564 | $382,982 | $30,710 | $352,272 |
| 2021 | $7,380 | $339,036 | $30,710 | $308,326 |
| 2020 | $7,775 | $362,507 | $292 | $362,215 |
| 2018 | $7,854 | $354,758 | $292 | $354,466 |
| 2017 | $7,842 | $351,624 | $292 | $351,332 |
| 2016 | $6,871 | $308,083 | $292 | $307,791 |
| 2015 | $6,313 | $285,523 | $292 | $285,231 |
| 2014 | $6,313 | $265,282 | $292 | $264,990 |
Landlord's Agent in 2025
Sam Massaed
Tower Realty Austin
(512) 963-9700
11 in this area
22 Total Sales
M
Tenant's Agent in 2025
Max Smirnoff
Uptown Realty LLC
(512) 968-2710
2 in this area
7 Total Sales
M
Seller's Agent in 2021
Michael May
Tower Realty Austin
(512) 947-8783
1 in this area
1 Total Sale
Seller Co-Listing Agent in 2020
Chesney Coker
Tower Realty Austin
(512) 289-4261
54 in this area
189 Total Sales
Source: Unlock MLS (Austin Board of REALTORS®)
MLS Number: 7280715
APN: 702760
Disclaimer: Certain information contained herein is derived from information provided by parties other than Homes.com. All information provided is deemed reliable, but is not guaranteed to be accurate and should be independently verified.
![]() Based on information from the Austin Board of REALTORS® (alternatively, from ACTRIS). Neither the Board nor ACTRIS guarantees or is in any way responsible for its accuracy. All data is provided “AS IS” and with all faults. Data maintained by the Board or ACTRIS may not reflect all real estate activity in the market.
Based on information from the Austin Board of REALTORS® (alternatively, from ACTRIS). Neither the Board nor ACTRIS guarantees or is in any way responsible for its accuracy. All data is provided “AS IS” and with all faults. Data maintained by the Board or ACTRIS may not reflect all real estate activity in the market.
Information being provided is for consumers’ personal, non-commercial use and may not be used for any purpose other than to identify prospective properties consumers may be interested in purchasing.
The Digital Millennium Copyright Act of 1998, 17 U.S.C. § 512 (the “DMCA”) provides recourse for copyright owners who believe that material appearing on the Internet infringes their rights under U.S. copyright law. If you believe in good faith that any content or material made available in connection with our website or services infringes your copyright, you (or your agent) may send us a notice requesting that the content or material be removed, or access to it blocked.
Notices must be sent in writing by email to DMCAnotice@MLSGrid.com.
The DMCA requires that your notice of alleged copyright infringement include the following information:
(1) description of the copyrighted work that is the subject of claimed infringement;
(2) description of the alleged infringing content and information sufficient to permit us to locate the content;
(3) contact information for you, including your address, telephone number and email address;
(4) a statement by you that you have a good faith belief that the content in the manner complained of is not authorized by the copyright owner, or its agent, or by the operation of any law;
(5) a statement by you, signed under penalty of perjury, that the information in the notification is accurate and that you have the authority to enforce the copyrights that are claimed to be infringed; and
(6) a physical or electronic signature of the copyright owner or a person authorized to act on the copyright owner’s behalf. Failure to include all of the above information may result in the delay of the processing of your complaint.