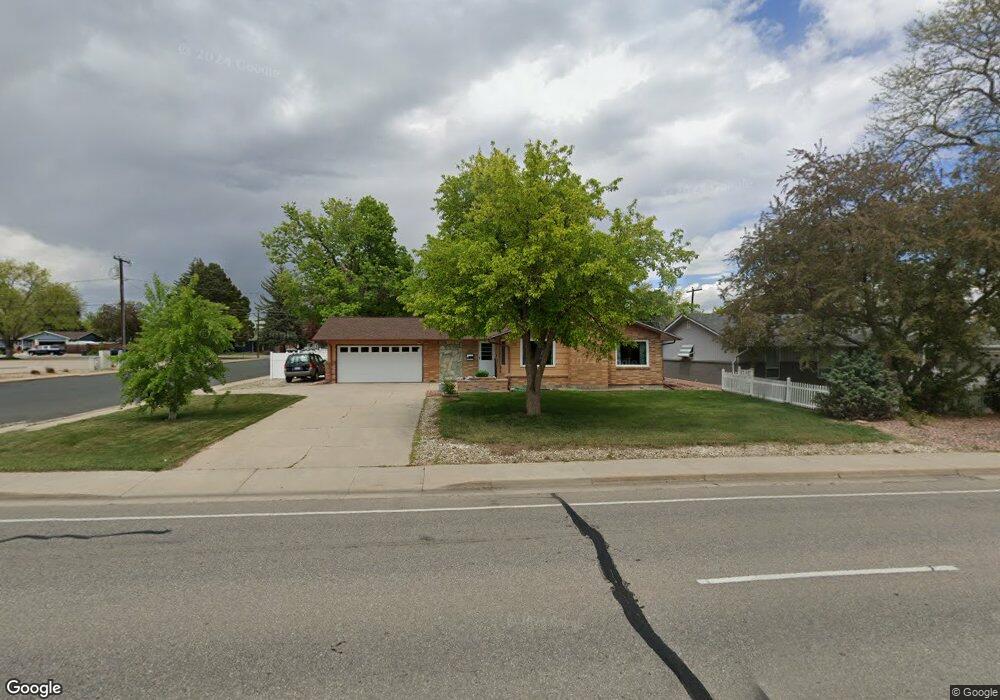
711 W 29th St Loveland, CO 80538
Estimated Value: $436,153 - $531,000
3
Beds
2
Baths
1,452
Sq Ft
$320/Sq Ft
Est. Value
About This Home
This home is located at 711 W 29th St, Loveland, CO 80538 and is currently estimated at $465,038, approximately $320 per square foot. 711 W 29th St is a home located in Larimer County with nearby schools including Lincoln Elementary School, Lucile Erwin Middle School, and Loveland High School.
Ownership History
Date
Name
Owned For
Owner Type
Purchase Details
Closed on
May 3, 2012
Sold by
Marshall Terry
Bought by
Marshall Terry and Marshall Deborah June
Current Estimated Value
Purchase Details
Closed on
Jul 28, 2005
Sold by
Loveland Church Of The Nazarene Inc
Bought by
Marshall Terry
Home Financials for this Owner
Home Financials are based on the most recent Mortgage that was taken out on this home.
Original Mortgage
$157,500
Outstanding Balance
$82,151
Interest Rate
5.55%
Mortgage Type
Fannie Mae Freddie Mac
Estimated Equity
$382,887
Purchase Details
Closed on
Feb 23, 2004
Sold by
Vance Douglas Eugene and Vance Avalee Ann
Bought by
Loveland Church Of The Nazarene Inc
Purchase Details
Closed on
May 21, 2003
Sold by
Vance Douglas Eugene
Bought by
Vance Douglas Eugene and Vance Avalee Ann
Purchase Details
Closed on
Sep 20, 2001
Sold by
Berkery Michael P and Berkery Gail E C
Bought by
Berkery Michael P and Berkery Gail E C
Create a Home Valuation Report for This Property
The Home Valuation Report is an in-depth analysis detailing your home's value as well as a comparison with similar homes in the area
Home Values in the Area
Average Home Value in this Area
Purchase History
| Date | Buyer | Sale Price | Title Company |
|---|---|---|---|
| Marshall Terry | -- | Chicago Title Co | |
| Marshall Terry | $175,000 | North Amer Title Co Of Co | |
| Loveland Church Of The Nazarene Inc | $165,000 | Fahtco | |
| Vance Douglas Eugene | -- | -- | |
| Berkery Michael P | -- | -- |
Source: Public Records
Mortgage History
| Date | Status | Borrower | Loan Amount |
|---|---|---|---|
| Open | Marshall Terry | $157,500 |
Source: Public Records
Tax History Compared to Growth
Tax History
| Year | Tax Paid | Tax Assessment Tax Assessment Total Assessment is a certain percentage of the fair market value that is determined by local assessors to be the total taxable value of land and additions on the property. | Land | Improvement |
|---|---|---|---|---|
| 2025 | $1,471 | $28,817 | $3,015 | $25,802 |
| 2024 | $1,419 | $28,817 | $3,015 | $25,802 |
| 2022 | $1,149 | $21,393 | $3,128 | $18,265 |
| 2021 | $1,181 | $22,008 | $3,218 | $18,790 |
| 2020 | $1,032 | $20,135 | $3,218 | $16,917 |
| 2019 | $1,015 | $20,135 | $3,218 | $16,917 |
| 2018 | $848 | $17,503 | $3,240 | $14,263 |
| 2017 | $730 | $17,503 | $3,240 | $14,263 |
| 2016 | $1,011 | $13,787 | $3,582 | $10,205 |
| 2015 | $1,003 | $13,780 | $3,580 | $10,200 |
| 2014 | $959 | $12,750 | $3,580 | $9,170 |
Source: Public Records
Map
Nearby Homes
- 706 W 29th St
- 3110 N Franklin Ave
- 3210 N Colorado Ave
- 2640 Logan Dr
- 3312 N Colorado Ave
- 367 Limber Place
- 3321 Butternut Dr
- 3523 N Franklin Ave
- 957 Logan Ct
- 717 W 36th St
- 3638 Butternut Dr Unit 7A
- 2609 Cedar Dr
- 2281 N Garfield Ave
- 2437 Mountain View Dr
- 3750 Sheridan Ave
- 2922 Alamosa Ct
- 1463 Caddoa Dr
- 3244 Hawthorn Dr
- 1221 Bay Ct
- 1428 W 25th St
- 707 W 29th St
- 712 W 30th St
- 708 W 30th St
- 703 W 29th St
- 703 W 29th St Unit Main
- 704 W 30th St
- 613 W 29th St
- 614 W 30th St
- 710 W 29th St
- 702 W 29th St
- 3002 N Colorado Ave
- 2844 Logan Dr
- 705 W 30th St
- 609 W 29th St
- 614 W 29th St
- 3003 N Colorado Ave
- 610 W 30th St
- 3006 N Colorado Ave
- 2832 Logan Dr
- 610 W 29th St