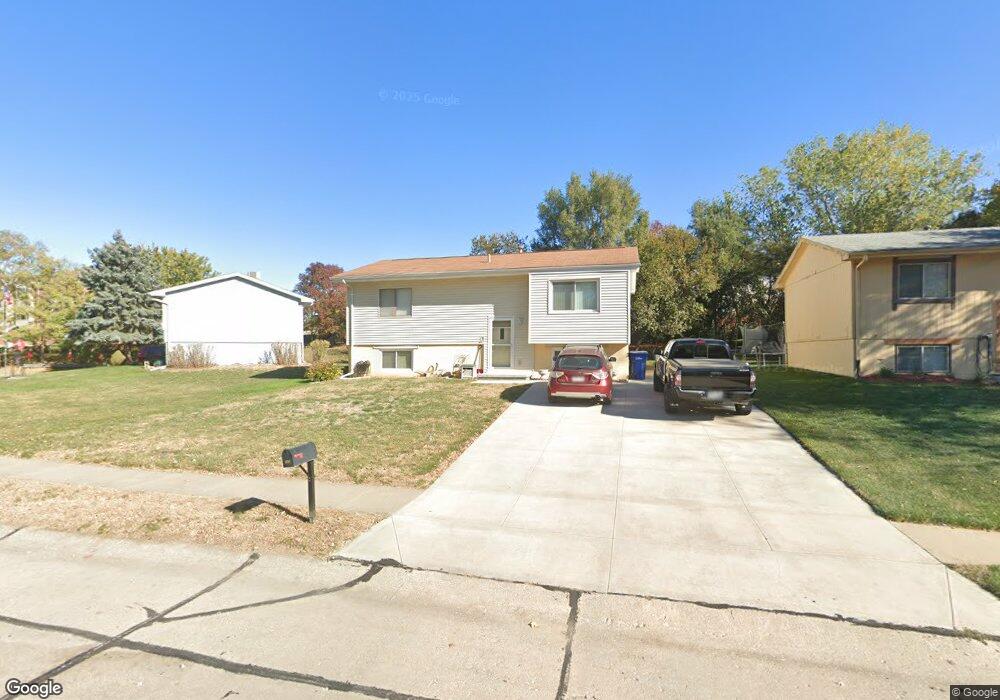
711 Willow Ave Bellevue, NE 68005
Estimated Value: $214,000 - $235,000
3
Beds
1
Bath
967
Sq Ft
$231/Sq Ft
Est. Value
About This Home
This home is located at 711 Willow Ave, Bellevue, NE 68005 and is currently estimated at $223,797, approximately $231 per square foot. 711 Willow Ave is a home located in Sarpy County with nearby schools including Twin Ridge Elementary School, Logan Fontenelle Middle School, and Bellevue West High School.
Ownership History
Date
Name
Owned For
Owner Type
Purchase Details
Closed on
Sep 16, 2016
Sold by
Andrews Donna Lee A
Bought by
Woodyerd Mark E
Current Estimated Value
Purchase Details
Closed on
Sep 27, 2002
Sold by
Woodyerd Mark E and Woodyerd Kathleen L
Bought by
Andrews Donna Lee A
Home Financials for this Owner
Home Financials are based on the most recent Mortgage that was taken out on this home.
Original Mortgage
$92,150
Interest Rate
6.01%
Purchase Details
Closed on
Nov 30, 1998
Sold by
K P Partnership
Bought by
Woodyerd Mark E and Woodyerd Kathleen L
Home Financials for this Owner
Home Financials are based on the most recent Mortgage that was taken out on this home.
Original Mortgage
$64,000
Interest Rate
11.25%
Create a Home Valuation Report for This Property
The Home Valuation Report is an in-depth analysis detailing your home's value as well as a comparison with similar homes in the area
Home Values in the Area
Average Home Value in this Area
Purchase History
| Date | Buyer | Sale Price | Title Company |
|---|---|---|---|
| Woodyerd Mark E | -- | None Available | |
| Andrews Donna Lee A | $97,000 | Liberty Title | |
| Woodyerd Mark E | $80,000 | -- |
Source: Public Records
Mortgage History
| Date | Status | Borrower | Loan Amount |
|---|---|---|---|
| Previous Owner | Andrews Donna Lee A | $92,150 | |
| Previous Owner | Woodyerd Mark E | $64,000 |
Source: Public Records
Tax History Compared to Growth
Tax History
| Year | Tax Paid | Tax Assessment Tax Assessment Total Assessment is a certain percentage of the fair market value that is determined by local assessors to be the total taxable value of land and additions on the property. | Land | Improvement |
|---|---|---|---|---|
| 2025 | $3,399 | $209,339 | $35,000 | $174,339 |
| 2024 | $3,782 | $194,861 | $32,500 | $162,361 |
| 2023 | $3,782 | $179,104 | $30,000 | $149,104 |
| 2022 | $3,358 | $156,026 | $25,000 | $131,026 |
| 2021 | $3,101 | $142,566 | $25,000 | $117,566 |
| 2020 | $3,001 | $137,505 | $25,000 | $112,505 |
| 2019 | $2,724 | $125,605 | $25,000 | $100,605 |
| 2018 | $2,515 | $119,087 | $21,000 | $98,087 |
| 2017 | $2,414 | $113,516 | $21,000 | $92,516 |
| 2016 | $2,242 | $107,768 | $21,000 | $86,768 |
| 2015 | $2,133 | $103,135 | $21,000 | $82,135 |
| 2014 | $2,126 | $102,143 | $21,000 | $81,143 |
| 2012 | -- | $99,658 | $21,000 | $78,658 |
Source: Public Records
Map
Nearby Homes
- 2813 Bryan Ave
- 2303 Lloyd St
- 1307 Terry Dr
- 10106 S 13th St
- 1213 Willow Ave
- 2203 Lloyd St
- 9912 S 9th Ave
- 10014 S 14th St
- 2113 Twinridge Dr
- 9903 S 10th St
- 1406 Sunshine Blvd
- 2308 Julie Cir
- 2804 Greensboro Ave
- 1409 Thomas Dr
- 2212 Greensboro Ave
- 2208 Greensboro Ave
- 11004 S 18th St
- 2303 Greensboro Ave
- 202 Caldor Dr
- 1509 Brenda Dr
- 713 Willow Ave
- 709 Willow Ave
- 715 Willow Ave
- 712 Fort Crook Rd S
- 714 Fort Crook Rd S Unit 714
- 706 Fort Crook Rd S
- 704 Fort Crook Rd S
- 717 Willow Ave
- 720 Willow Ave
- 712 Willow Ave
- 718 Willow Ave
- 722 Willow Ave
- 724 Willow Ave
- 719 Willow Ave
- 716 Willow Ave
- 710 Willow Ave
- 714 Willow Ave
- 726 Willow Ave
- 721 Willow Ave
- 723 Willow Cir