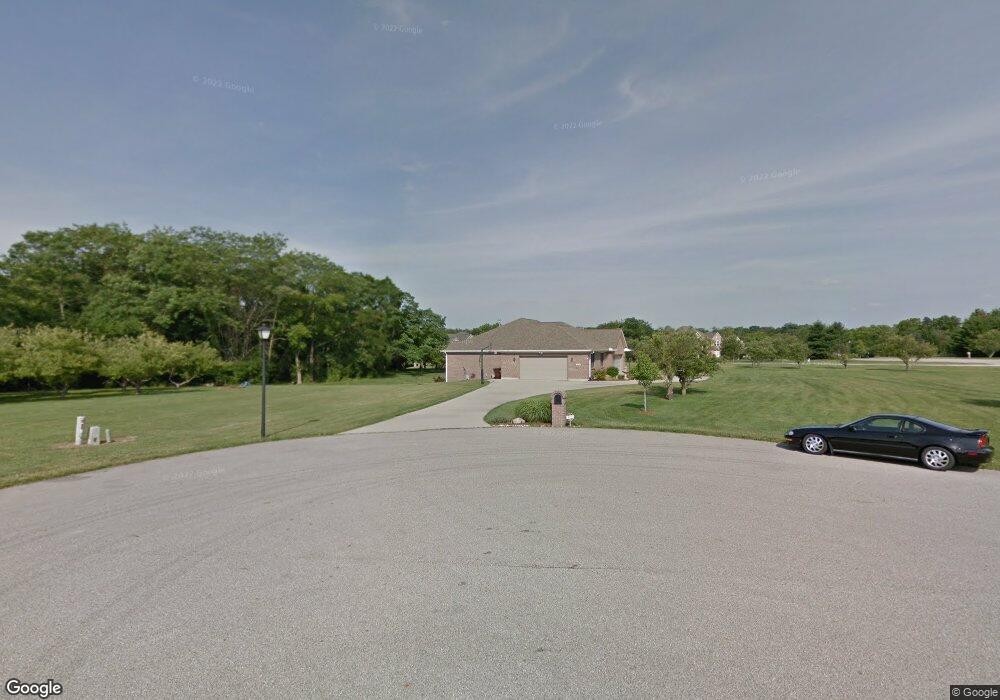
7110 Orchard View Ln Morrow, OH 45152
Estimated Value: $670,709 - $714,000
3
Beds
2
Baths
2,249
Sq Ft
$305/Sq Ft
Est. Value
About This Home
This home is located at 7110 Orchard View Ln, Morrow, OH 45152 and is currently estimated at $685,570, approximately $304 per square foot. 7110 Orchard View Ln is a home located in Warren County with nearby schools including Little Miami Early Childhood Center, Little Miami Intermediate Middle School, and Little Miami Middle School.
Ownership History
Date
Name
Owned For
Owner Type
Purchase Details
Closed on
Jun 17, 2024
Sold by
Philpot Jerry W and Philpot Doris A
Bought by
Philpot Family Trust and Philpot
Current Estimated Value
Purchase Details
Closed on
Jun 3, 2005
Sold by
Walsh David C and Walsh Susan E
Bought by
Philpot Jerry W and Philpot Doris A
Home Financials for this Owner
Home Financials are based on the most recent Mortgage that was taken out on this home.
Original Mortgage
$244,000
Interest Rate
5.82%
Mortgage Type
Unknown
Purchase Details
Closed on
Nov 3, 2000
Sold by
Morrow Lakes Ltd
Bought by
Walsh David C and Walsh E
Home Financials for this Owner
Home Financials are based on the most recent Mortgage that was taken out on this home.
Original Mortgage
$42,415
Interest Rate
7.96%
Mortgage Type
New Conventional
Create a Home Valuation Report for This Property
The Home Valuation Report is an in-depth analysis detailing your home's value as well as a comparison with similar homes in the area
Home Values in the Area
Average Home Value in this Area
Purchase History
| Date | Buyer | Sale Price | Title Company |
|---|---|---|---|
| Philpot Family Trust | -- | None Listed On Document | |
| Philpot Jerry W | $70,000 | Land America | |
| Walsh David C | $49,900 | -- |
Source: Public Records
Mortgage History
| Date | Status | Borrower | Loan Amount |
|---|---|---|---|
| Previous Owner | Philpot Jerry W | $244,000 | |
| Previous Owner | Walsh David C | $42,415 |
Source: Public Records
Tax History
| Year | Tax Paid | Tax Assessment Tax Assessment Total Assessment is a certain percentage of the fair market value that is determined by local assessors to be the total taxable value of land and additions on the property. | Land | Improvement |
|---|---|---|---|---|
| 2025 | $8,271 | $181,420 | $52,760 | $128,660 |
| 2024 | $8,271 | $181,420 | $52,760 | $128,660 |
| 2023 | $7,554 | $147,738 | $33,782 | $113,956 |
| 2022 | $7,462 | $147,739 | $33,782 | $113,957 |
| 2021 | $7,129 | $147,739 | $33,782 | $113,957 |
| 2020 | $6,817 | $120,113 | $27,465 | $92,649 |
| 2019 | $6,932 | $120,113 | $27,465 | $92,649 |
| 2018 | $6,988 | $120,113 | $27,465 | $92,649 |
| 2017 | $6,119 | $102,120 | $22,859 | $79,261 |
| 2016 | $6,246 | $102,120 | $22,859 | $79,261 |
| 2015 | $5,858 | $102,120 | $22,859 | $79,261 |
| 2014 | $6,295 | $99,410 | $22,460 | $76,950 |
| 2013 | $6,191 | $120,950 | $25,660 | $95,290 |
Source: Public Records
Map
Nearby Homes
- 7577 Misty Woods Ct
- 7152 Gheils Carroll Rd
- 5750 Azra Ct
- 6017 Outlook Ct
- 6590 Morrow Rossburg Rd
- 5168 Allens Ridge Dr
- 4910 Allens Ridge Dr
- 4054 E Foster Maineville Rd
- 4798 Sullivans Ridge Dr
- 4698 Jessica Suzanne Dr
- 3163 Rosemary Ct
- Lot #1 Middleboro Rd
- 5021 Sullivan's Ridge Dr
- 5815 Josie’s Cove
- 4836 Jessica Suzanne Dr
- 5670 Julia Kate Dr
- 6496 Cooper Grace Ln
- 6448 Cooper Grace Ln
- 6491 Cooper Grace Ln
- 5056 Mary Louise Ct
- 4610 Misty Ridge Ct
- 4622 Misty Ridge Ct
- 4597 Misty Ridge Ct
- 6701 Morrow Woodville Rd
- 7131 Orchard View Ln
- 7185 Orchard View Ln
- 4623 Misty Ridge Ct
- 6743 Morrow Woodville Rd
- 4629 Misty Ridge Ct
- 7239 Orchard View Ln
- 7238 Orchard View Ln
- 16.8ac Morrow-Woodville Rd
- 5.4ac Morrow-Woodville Rd
- 6753 Morrow Woodville Rd
- 7096 Misty Meadow Ln
- 7281 Orchard View Ln
- 7278 Orchard View Ln
- 7068 Misty Meadow Ln
- 7120 Misty Meadow Ln
- 7284 Orchard View Ln
Your Personal Tour Guide
Ask me questions while you tour the home.