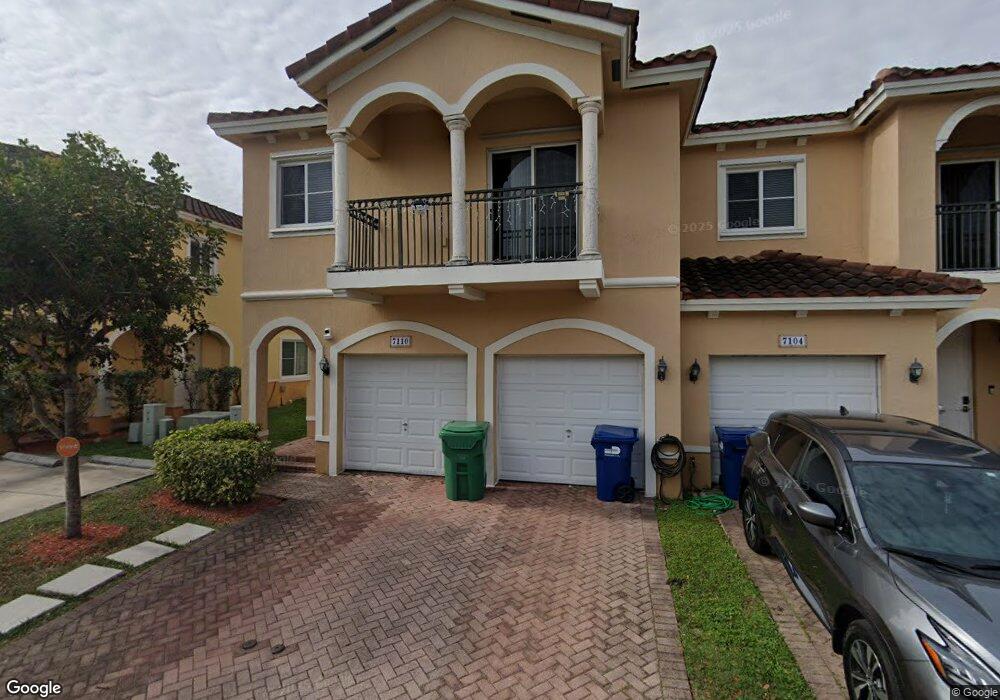
7110 SW 166th Place Miami, FL 33193
West Kendall NeighborhoodEstimated Value: $562,000 - $588,000
4
Beds
2
Baths
1,991
Sq Ft
$288/Sq Ft
Est. Value
About This Home
This home is located at 7110 SW 166th Place, Miami, FL 33193 and is currently estimated at $573,308, approximately $287 per square foot. 7110 SW 166th Place is a home located in Miami-Dade County with nearby schools including Dr. Manuel C. Barreiro Elementary School, Lamar Louise Curry Middle School, and John A. Ferguson Senior High School.
Ownership History
Date
Name
Owned For
Owner Type
Purchase Details
Closed on
May 28, 2019
Sold by
Fantauzzi Destiny N and Garcia Jonathan J
Bought by
Marquez Javier and Lopez Tamara
Current Estimated Value
Home Financials for this Owner
Home Financials are based on the most recent Mortgage that was taken out on this home.
Original Mortgage
$322,040
Outstanding Balance
$283,152
Interest Rate
4.1%
Mortgage Type
New Conventional
Estimated Equity
$290,156
Purchase Details
Closed on
Dec 5, 2014
Sold by
American Investments Group Llc
Bought by
Fantauzzi Destiny N and Garcia Jonathan J
Home Financials for this Owner
Home Financials are based on the most recent Mortgage that was taken out on this home.
Original Mortgage
$267,073
Interest Rate
4.75%
Mortgage Type
FHA
Purchase Details
Closed on
Jul 22, 2009
Sold by
Bgr Development Llc
Bought by
American Investment Group Llc
Create a Home Valuation Report for This Property
The Home Valuation Report is an in-depth analysis detailing your home's value as well as a comparison with similar homes in the area
Home Values in the Area
Average Home Value in this Area
Purchase History
| Date | Buyer | Sale Price | Title Company |
|---|---|---|---|
| Marquez Javier | $332,000 | Epic Title Group | |
| Fantauzzi Destiny N | $278,500 | Colonial Title Services Inc | |
| American Investment Group Llc | $340,000 | Colonial Title Services Inc |
Source: Public Records
Mortgage History
| Date | Status | Borrower | Loan Amount |
|---|---|---|---|
| Open | Marquez Javier | $322,040 | |
| Previous Owner | Fantauzzi Destiny N | $267,073 |
Source: Public Records
Tax History Compared to Growth
Tax History
| Year | Tax Paid | Tax Assessment Tax Assessment Total Assessment is a certain percentage of the fair market value that is determined by local assessors to be the total taxable value of land and additions on the property. | Land | Improvement |
|---|---|---|---|---|
| 2025 | $5,249 | $315,822 | -- | -- |
| 2024 | $4,993 | $306,922 | -- | -- |
| 2023 | $4,993 | $297,983 | $0 | $0 |
| 2022 | $4,802 | $289,304 | $0 | $0 |
| 2021 | $4,759 | $280,878 | $0 | $0 |
| 2020 | $4,705 | $277,000 | $0 | $0 |
| 2019 | $3,940 | $233,146 | $0 | $0 |
| 2018 | $3,720 | $228,799 | $0 | $0 |
| 2017 | $3,696 | $224,094 | $0 | $0 |
| 2016 | $3,666 | $219,485 | $0 | $0 |
| 2015 | $3,697 | $217,960 | $0 | $0 |
| 2014 | -- | $22,308 | $0 | $0 |
Source: Public Records
Map
Nearby Homes
- 16620 SW 70th St
- 16618 SW 68th Terrace
- 16544 SW 68th Terrace
- 16448 SW 67th Terrace
- 6641 SW 166th Ct
- 7161 SW 163rd Place
- 7515 SW 164th Ct
- 7310 SW 163rd Place
- 16491 SW 64th Terrace
- 16258 SW 68th Terrace
- 7362 SW 162nd Place
- 7307 SW 162nd Place
- 6425 SW 164th Ave
- 7838 SW 166th Place
- 7486 SW 162nd Ct
- 16609 SW 79th Terrace
- 7831 SW 164th Ave
- 7045 SW 161st Place
- 7936 SW 164th Place
- 16173 SW 72nd Terrace
- 7104 SW 166th Place
- 7104 SW 166th Place
- 7116 SW 166th Place
- 7064 SW 166th Place
- 7064 SW 166th Place
- 7122 SW 166th Place Unit 7122
- 7122 SW 166th Place
- 7058 SW 166th Place
- 7128 SW 166th Place
- 7052 SW 166th Place
- 7103 SW 166th Place
- 7109 SW 166th Place
- 7134 SW 166th Place
- 7115 SW 166th Place
- 7046 SW 166th Place
- 7121 SW 166th Place
- 7063 SW 166th Place
- 7127 SW 166th Place
- 7140 SW 166th Place
- 7057 SW 166th Place