7111 Showcase Ln Orlando, FL 32819
Universal NeighborhoodEstimated Value: $377,522 - $420,000
3
Beds
3
Baths
1,524
Sq Ft
$260/Sq Ft
Est. Value
About This Home
This home is located at 7111 Showcase Ln, Orlando, FL 32819 and is currently estimated at $395,631, approximately $259 per square foot. 7111 Showcase Ln is a home located in Orange County with nearby schools including Dr. Phillips High School, Dr. Phillips Elementary School, and Southwest Middle.
Ownership History
Date
Name
Owned For
Owner Type
Purchase Details
Closed on
Jun 19, 2025
Sold by
Williams Caren Alison
Bought by
Freiburger Jenifer
Current Estimated Value
Purchase Details
Closed on
Apr 27, 2007
Sold by
Chevere Hector J
Bought by
Williams Ina Ruth
Home Financials for this Owner
Home Financials are based on the most recent Mortgage that was taken out on this home.
Original Mortgage
$258,400
Interest Rate
6.11%
Mortgage Type
Purchase Money Mortgage
Purchase Details
Closed on
Jan 26, 2007
Sold by
Pulte Home Corp
Bought by
Chevere Hector J
Home Financials for this Owner
Home Financials are based on the most recent Mortgage that was taken out on this home.
Original Mortgage
$30,500
Interest Rate
5.86%
Mortgage Type
Stand Alone Second
Create a Home Valuation Report for This Property
The Home Valuation Report is an in-depth analysis detailing your home's value as well as a comparison with similar homes in the area
Home Values in the Area
Average Home Value in this Area
Purchase History
| Date | Buyer | Sale Price | Title Company |
|---|---|---|---|
| Freiburger Jenifer | $100 | None Listed On Document | |
| Williams Ina Ruth | $338,000 | Equitable Title Svcs Ltd #4 | |
| Chevere Hector J | $305,000 | Landamerica Gulfatlantic Tit |
Source: Public Records
Mortgage History
| Date | Status | Borrower | Loan Amount |
|---|---|---|---|
| Previous Owner | Williams Ina Ruth | $258,400 | |
| Previous Owner | Chevere Hector J | $30,500 | |
| Previous Owner | Chevere Hector J | $244,000 |
Source: Public Records
Tax History
| Year | Tax Paid | Tax Assessment Tax Assessment Total Assessment is a certain percentage of the fair market value that is determined by local assessors to be the total taxable value of land and additions on the property. | Land | Improvement |
|---|---|---|---|---|
| 2025 | $6,145 | $333,330 | $45,000 | $288,330 |
| 2024 | $5,280 | $333,330 | $45,000 | $288,330 |
| 2023 | $5,280 | $288,334 | $45,000 | $243,334 |
| 2022 | $4,910 | $269,439 | $45,000 | $224,439 |
| 2021 | $4,523 | $241,939 | $45,000 | $196,939 |
| 2020 | $4,310 | $238,452 | $40,000 | $198,452 |
| 2019 | $4,487 | $234,965 | $35,000 | $199,965 |
| 2018 | $4,340 | $224,724 | $30,000 | $194,724 |
| 2017 | $4,145 | $219,611 | $30,000 | $189,611 |
| 2016 | $3,831 | $197,767 | $30,000 | $167,767 |
| 2015 | $3,620 | $186,467 | $30,000 | $156,467 |
| 2014 | $3,419 | $178,351 | $30,000 | $148,351 |
Source: Public Records
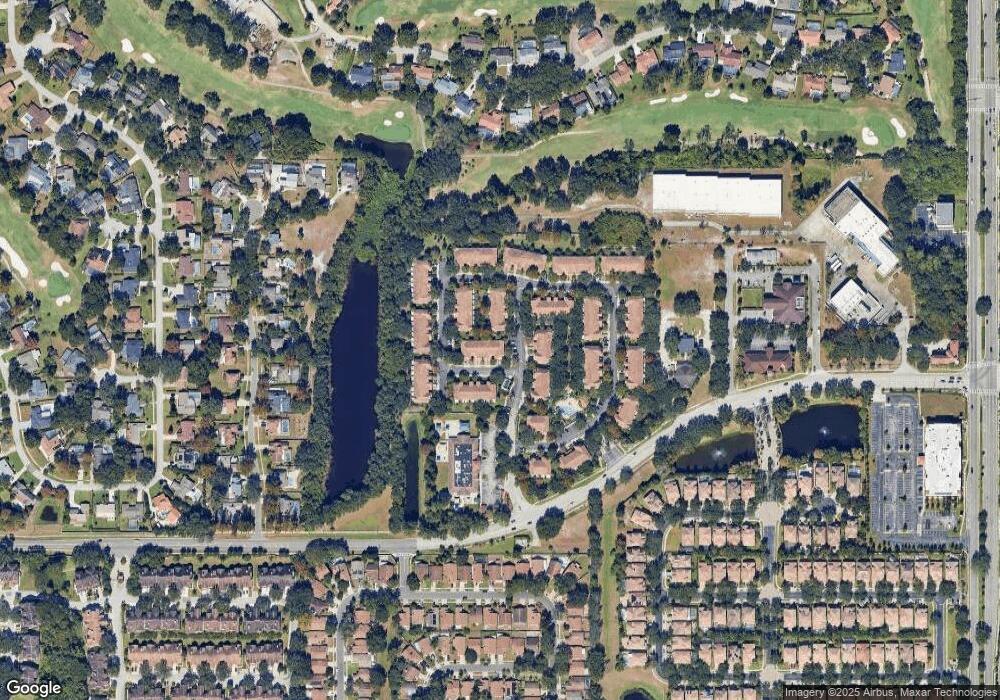
Map
Nearby Homes
- 7062 Cadiz Blvd
- 6810 Hochad Dr
- 7022 Cadiz Blvd
- 6850 Spring Rain Dr
- 6649 Parson Brown Dr
- 6976 Lucca St
- 6956 Lucca St
- 6790 Edgeworth Dr
- 7224 Greenville Ct
- 6829 Bittersweet Ln
- 6642 Parson Brown Dr
- 6609 Edgeworth Dr
- 7000 Stonehedge Dr Unit 156
- 7420 Cypress Grove Rd Unit 132
- 6841 Dolce St
- 6959 Sorrento St
- 7617 Bay Port Rd Unit 57
- 7166 Regina Way
- 7619 Bay Port Rd Unit 59
- 7624 Bay Port Rd Unit 40
- 7119 Showcase Ln
- 7127 Showcase Ln
- 7135 Showcase Ln
- 7143 Showcase Ln
- 7151 Showcase Ln
- 6866 Slaven Dr Unit 119
- 7159 Showcase Ln
- 6858 Slaven Dr
- 6858 Slaven Dr
- 6850 Slaven Dr
- 7167 Showcase Ln Unit 7167
- 7167 Showcase Ln
- 7167 Showcase Ln Unit 104
- 6859 Slaven Dr
- 6859 Slaven Dr Unit 129
- 6845 Slaven Dr
- 7114 Showcase Ln Unit 96
- 7114 Showcase Ln
- 6887 Slaven Dr Unit 127
- 6887 Slaven Dr
Your Personal Tour Guide
Ask me questions while you tour the home.