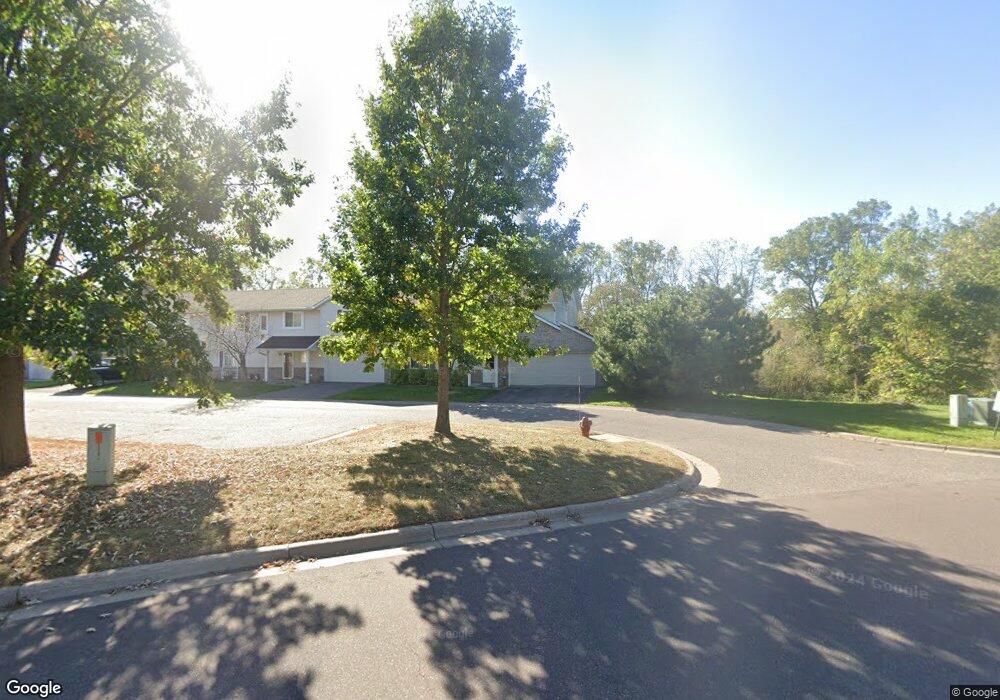
7112 Jorgensen Ln S Cottage Grove, MN 55016
Estimated Value: $255,000 - $272,636
3
Beds
2
Baths
1,584
Sq Ft
$166/Sq Ft
Est. Value
About This Home
This home is located at 7112 Jorgensen Ln S, Cottage Grove, MN 55016 and is currently estimated at $263,409, approximately $166 per square foot. 7112 Jorgensen Ln S is a home located in Washington County with nearby schools including Liberty Ridge Elementary School, Cottage Grove Middle School, and East Ridge High School.
Ownership History
Date
Name
Owned For
Owner Type
Purchase Details
Closed on
Jan 28, 2022
Sold by
Solaja Kimberly A
Bought by
Suter Nickolas
Current Estimated Value
Home Financials for this Owner
Home Financials are based on the most recent Mortgage that was taken out on this home.
Original Mortgage
$229,440
Outstanding Balance
$213,078
Interest Rate
3.56%
Mortgage Type
New Conventional
Estimated Equity
$50,331
Purchase Details
Closed on
Sep 26, 2016
Sold by
Heckman David M
Bought by
Burger Kimberly and Solaja Stephen Olumide
Home Financials for this Owner
Home Financials are based on the most recent Mortgage that was taken out on this home.
Original Mortgage
$166,155
Interest Rate
3.43%
Mortgage Type
New Conventional
Purchase Details
Closed on
Sep 27, 2002
Sold by
Mw Johnson Construction
Bought by
Peyton Denise and Beyton Bruce
Create a Home Valuation Report for This Property
The Home Valuation Report is an in-depth analysis detailing your home's value as well as a comparison with similar homes in the area
Home Values in the Area
Average Home Value in this Area
Purchase History
| Date | Buyer | Sale Price | Title Company |
|---|---|---|---|
| Suter Nickolas | $239,000 | None Listed On Document | |
| Burger Kimberly | $174,900 | Trademark Title Services Inc | |
| Peyton Denise | $175,415 | -- |
Source: Public Records
Mortgage History
| Date | Status | Borrower | Loan Amount |
|---|---|---|---|
| Open | Suter Nickolas | $229,440 | |
| Previous Owner | Burger Kimberly | $166,155 |
Source: Public Records
Tax History Compared to Growth
Tax History
| Year | Tax Paid | Tax Assessment Tax Assessment Total Assessment is a certain percentage of the fair market value that is determined by local assessors to be the total taxable value of land and additions on the property. | Land | Improvement |
|---|---|---|---|---|
| 2024 | $2,966 | $247,700 | $78,000 | $169,700 |
| 2023 | $2,966 | $240,300 | $67,800 | $172,500 |
| 2022 | $2,398 | $220,200 | $52,400 | $167,800 |
| 2021 | $2,272 | $187,300 | $43,600 | $143,700 |
| 2020 | $2,322 | $180,600 | $48,400 | $132,200 |
| 2019 | $2,240 | $179,000 | $45,000 | $134,000 |
| 2018 | $1,970 | $169,900 | $46,500 | $123,400 |
| 2017 | $1,786 | $149,800 | $34,500 | $115,300 |
| 2016 | $1,828 | $140,300 | $26,400 | $113,900 |
| 2015 | $1,434 | $100,500 | $15,900 | $84,600 |
| 2013 | -- | $93,100 | $15,600 | $77,500 |
Source: Public Records
Map
Nearby Homes
- 6812 Jody Ave S
- 6725 Jorgensen Ave S
- 6721 Jorgensen Ave S
- 6708 Jorgensen Ave S
- 6700 Jorgensen Ave S
- 6671 Jody Ave S
- 9441 71st St S
- 9890 77th St S
- 9287 73rd St S
- 9320 67th St S
- 9634 65th St S
- 9268 Indian Blvd S
- 9163 67th St S
- 7316 Janero Ave S
- 7733 Jeffery Ave S
- 6192 Jensen Ave S
- 9496 63rd St S
- 6388 Jeffery Ave S
- 6205 Jensen Ave S
- 6090 Jensen Ave S
- 7114 Jorgensen Ln S
- 7116 Jorgensen Ln S
- 7138 Jorgensen Ln S
- 7120 Jorgensen Ln S
- 7136 Jorgensen Ln S
- 7140 Jorgensen Ln S
- 7122 Jorgensen Ln S
- 7149 Joplin Ave S
- 7134 Jorgensen Ln S
- 7161 Joplin Ave S
- 7142 Jorgensen Ln S
- 7137 Joplin Ave S
- 7072 Jorgensen Ln S
- 7060 Jorgensen Ln S
- 7124 Jorgensen Ln S
- 7132 Jorgensen Ln S
- 7173 Joplin Ave S
- 7144 Jorgensen Ln S
- 7121 Joplin Ave S
- 7146 Jorgensen Ln S