7112 Seneca Falls Loop Austin, TX 78739
Circle C Ranch NeighborhoodEstimated Value: $822,821 - $947,000
About This Home
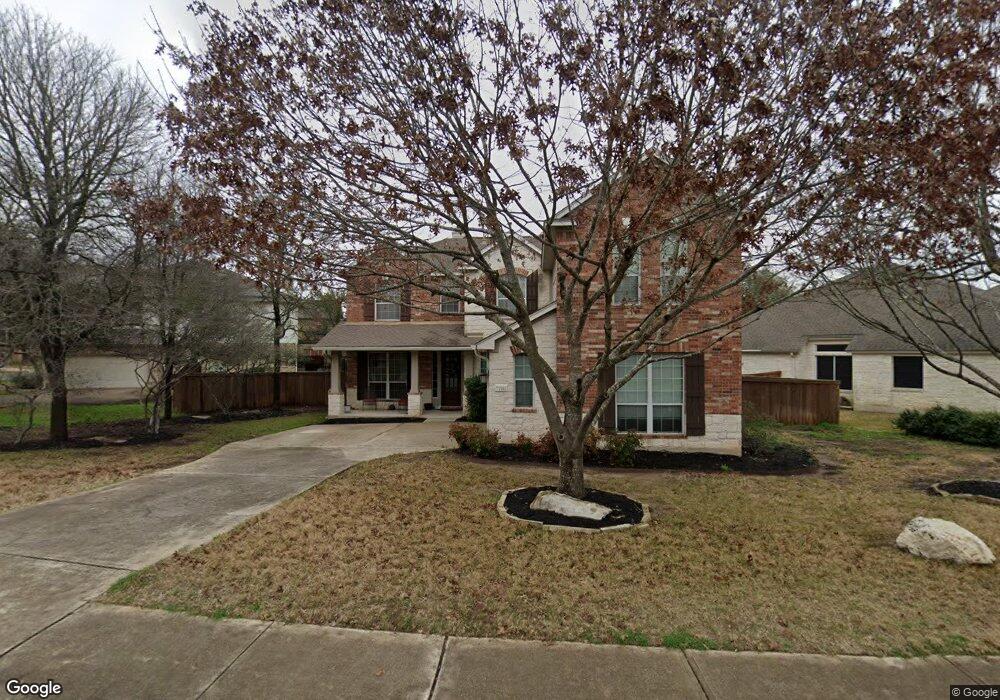
This home is located at 7112 Seneca Falls Loop, Austin, TX 78739 and is currently estimated at $877,455, approximately $270 per square foot. 7112 Seneca Falls Loop is a home located in Travis County with nearby schools including Clayton Elementary School, Gorzycki Middle School, and James Bowie High School.
Ownership History
We collect this data history from publicly available records. To have your information removed, we recommend requesting removal directly through your county’s website.
Purchase Details
Home Financials for this Owner
Home Financials are based on the most recent Mortgage that was taken out on this home.Home Values in the Area
Average Home Value in this Area
Purchase History
We collect this data history from publicly available records. To have your information removed, we recommend requesting removal directly through your county’s website.
| Date | Buyer | Sale Price | Title Company |
|---|---|---|---|
| -- | Independence Title Co |
Mortgage History
We collect this data history from publicly available records. To have your information removed, we recommend requesting removal directly through your county’s website.
| Date | Status | Borrower | Loan Amount |
|---|---|---|---|
| Open | $251,200 |
Tax History
We collect this data history from publicly available records. To have your information removed, we recommend requesting removal directly through your county’s website.
| Year | Tax Paid | Tax Assessment Tax Assessment Total Assessment is a certain percentage of the fair market value that is determined by local assessors to be the total taxable value of land and additions on the property. | Land | Improvement |
|---|---|---|---|---|
| 2025 | $13,629 | $810,277 | $335,083 | $475,194 |
| 2023 | $13,047 | $708,969 | -- | -- |
| 2022 | $12,729 | $644,517 | $0 | $0 |
| 2021 | $12,754 | $585,925 | $130,000 | $504,200 |
| 2020 | $11,425 | $532,659 | $130,000 | $402,659 |
| 2018 | $10,893 | $492,000 | $100,000 | $392,000 |
| 2017 | $10,831 | $485,679 | $50,000 | $435,679 |
| 2016 | $10,599 | $475,269 | $50,000 | $425,269 |
| 2015 | $8,894 | $432,989 | $52,500 | $380,489 |
| 2014 | $8,894 | $401,260 | $52,500 | $348,760 |
Map
- 7301 Seneca Falls Loop
- 10520 Hansa Dr
- 7416 Brecourt Manor Way
- 6729 Hansa Loop
- 10708 Natick Ln
- 6805 Blissfield Dr
- 10901 Doswell Cove
- 6405 Gouldville Ct
- 11129 Bastogne Loop
- 11208 Bastogne Loop
- 6420 Wareham Ln
- 6530 Needham Ln
- 6513 Way Ln
- 6435 Old Harbor Ln
- 6437 Old Harbor Ln
- 10901 Tornasol Ln
- 6123 Ginita Ln
- 11600 Coalwood Cove
- 6118 Ginita Ln
- 10905 Grassmere Ct
- 7108 Seneca Falls Loop
- 7200 Seneca Falls Loop
- 7104 Seneca Falls Loop
- 10601 California Cove
- 7212 Seneca Falls Loop
- 10600 California Cove
- 7113 Seneca Falls Loop
- 7100 Seneca Falls Loop
- 7216 Seneca Falls Loop
- 7109 Seneca Falls Loop
- 7205 Seneca Falls Loop
- 7105 Seneca Falls Loop
- 7209 Seneca Falls Loop
- 7220 Seneca Falls Loop
- 10604 California Cove
- 10609 California Cove
- 7213 Seneca Falls Loop
- 7101 Seneca Falls Loop
- 6921 Seneca Falls Ln
- 10608 California Cove
Ask me questions while you tour the home.