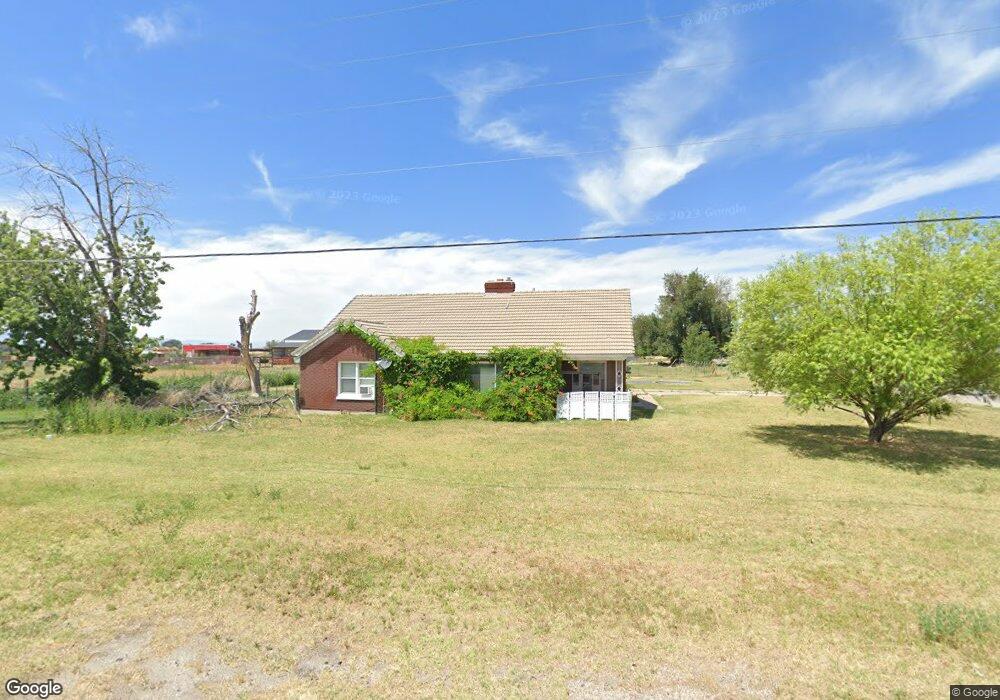
7112 W 5500 S Hooper, UT 84315
Estimated Value: $441,000 - $540,000
2
Beds
1
Bath
1,392
Sq Ft
$345/Sq Ft
Est. Value
About This Home
This home is located at 7112 W 5500 S, Hooper, UT 84315 and is currently estimated at $480,562, approximately $345 per square foot. 7112 W 5500 S is a home located in Weber County with nearby schools including Hooper Elementary School, Rocky Mountain Junior High School, and Fremont High School.
Ownership History
Date
Name
Owned For
Owner Type
Purchase Details
Closed on
Jul 25, 2019
Sold by
Mathis Shelley
Bought by
Seven Ventures Llc
Current Estimated Value
Home Financials for this Owner
Home Financials are based on the most recent Mortgage that was taken out on this home.
Original Mortgage
$165,900
Outstanding Balance
$145,343
Interest Rate
3.82%
Mortgage Type
Purchase Money Mortgage
Estimated Equity
$335,219
Purchase Details
Closed on
May 14, 2019
Sold by
Mathis Shelley and Harkins Shelley N
Bought by
Mathis Shelley
Home Financials for this Owner
Home Financials are based on the most recent Mortgage that was taken out on this home.
Original Mortgage
$153,400
Interest Rate
4.12%
Mortgage Type
Adjustable Rate Mortgage/ARM
Purchase Details
Closed on
Sep 30, 1998
Sold by
Rosenthal Gerald S and Rosenthal Cleta M
Bought by
Harkins Shelley N
Home Financials for this Owner
Home Financials are based on the most recent Mortgage that was taken out on this home.
Original Mortgage
$116,850
Interest Rate
6.88%
Create a Home Valuation Report for This Property
The Home Valuation Report is an in-depth analysis detailing your home's value as well as a comparison with similar homes in the area
Home Values in the Area
Average Home Value in this Area
Purchase History
| Date | Buyer | Sale Price | Title Company |
|---|---|---|---|
| Seven Ventures Llc | -- | Us Title Insurance Agency | |
| Mathis Shelley | -- | Novare National Setmnt Svcs | |
| Harkins Shelley N | -- | U S Title |
Source: Public Records
Mortgage History
| Date | Status | Borrower | Loan Amount |
|---|---|---|---|
| Open | Seven Ventures Llc | $165,900 | |
| Previous Owner | Mathis Shelley | $153,400 | |
| Previous Owner | Harkins Shelley N | $116,850 |
Source: Public Records
Tax History Compared to Growth
Tax History
| Year | Tax Paid | Tax Assessment Tax Assessment Total Assessment is a certain percentage of the fair market value that is determined by local assessors to be the total taxable value of land and additions on the property. | Land | Improvement |
|---|---|---|---|---|
| 2025 | $2,223 | $408,975 | $169,491 | $239,484 |
| 2024 | $2,142 | $402,000 | $169,491 | $232,509 |
| 2023 | $1,904 | $353,000 | $161,867 | $191,133 |
| 2022 | $2,042 | $386,000 | $124,891 | $261,109 |
| 2021 | $1,544 | $288,000 | $84,067 | $203,933 |
| 2020 | $1,464 | $253,000 | $73,750 | $179,250 |
| 2019 | $1,561 | $237,000 | $61,060 | $175,940 |
| 2018 | $1,396 | $203,000 | $61,060 | $141,940 |
| 2017 | $1,218 | $172,000 | $46,777 | $125,223 |
| 2016 | $1,239 | $94,759 | $24,717 | $70,042 |
| 2015 | $1,247 | $94,189 | $27,482 | $66,707 |
| 2014 | $1,169 | $85,997 | $27,482 | $58,515 |
Source: Public Records
Map
Nearby Homes
- 5319 S 7100 W
- 5801 S 7100 W
- 6360 W 5500 S
- 5752 W 2425 N
- 6014 W 5300 S
- 4100 S 5900 W
- 0 W 5500 S
- 6036 W 4700 S
- 3729 S 5600 W Unit 6
- 3720 S 5600 W Unit 2
- 3719 S 5600 W Unit 7
- 4146 S 5800 W Unit 5
- 4163 S 5800 W Unit 2
- 5335 W 5500 S
- 3632 S 5400 W
- 2084 N 4500 W
- 4879 S 5050 W
- 4111 S 5350 W
- 3706 S 5650 W Unit 9
- 2462 N Hooded Crane Ct