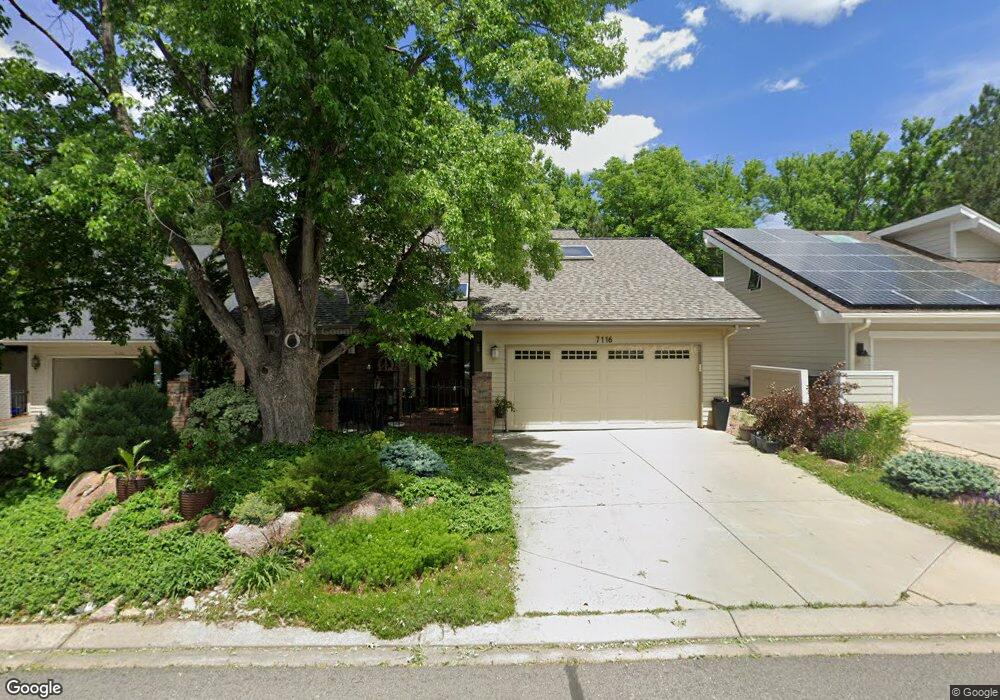
7116 Cedarwood Cir Boulder, CO 80301
Gunbarrel NeighborhoodEstimated Value: $1,232,026 - $1,449,000
4
Beds
4
Baths
3,589
Sq Ft
$386/Sq Ft
Est. Value
About This Home
This home is located at 7116 Cedarwood Cir, Boulder, CO 80301 and is currently estimated at $1,386,507, approximately $386 per square foot. 7116 Cedarwood Cir is a home located in Boulder County with nearby schools including Heatherwood Elementary School, Nevin Platt Middle School, and Boulder High School.
Ownership History
Date
Name
Owned For
Owner Type
Purchase Details
Closed on
Dec 21, 2018
Sold by
Crothers Edward
Bought by
Crothers Edward and The Crothers Trust
Current Estimated Value
Purchase Details
Closed on
May 26, 2010
Sold by
Walck Joseph C and Walck Pamella T
Bought by
Crothers Edward J
Purchase Details
Closed on
Oct 5, 2007
Sold by
John B & Myrtle E Trumble Loving Trust
Bought by
Walck Joseph C
Purchase Details
Closed on
Jan 21, 1994
Sold by
Trumble John B and Trumble Myrtle E
Bought by
Trumble John B
Purchase Details
Closed on
Nov 5, 1993
Sold by
Reiter Elmar R and Reiter Gabriella J
Bought by
Trumble John B
Home Financials for this Owner
Home Financials are based on the most recent Mortgage that was taken out on this home.
Original Mortgage
$50,000
Interest Rate
6.96%
Purchase Details
Closed on
Jun 18, 1990
Bought by
Crothers Edward J
Purchase Details
Closed on
Sep 28, 1978
Bought by
Crothers Edward J
Create a Home Valuation Report for This Property
The Home Valuation Report is an in-depth analysis detailing your home's value as well as a comparison with similar homes in the area
Home Values in the Area
Average Home Value in this Area
Purchase History
We collect this data history from publicly available records. To have your information removed, we recommend requesting removal directly through your county’s website.
| Date | Buyer | Sale Price | Title Company |
|---|---|---|---|
| Crothers Edward | -- | None Available | |
| Crothers Edward J | $589,900 | Land Title Guarantee Company | |
| Walck Joseph C | $370,000 | Fahtco | |
| Trumble John B | -- | -- | |
| Trumble John B | $245,000 | -- | |
| Crothers Edward J | $182,500 | -- | |
| Crothers Edward J | $110,100 | -- |
Source: Public Records
Mortgage History
We collect this data history from publicly available records. To have your information removed, we recommend requesting removal directly through your county’s website.
| Date | Status | Borrower | Loan Amount |
|---|---|---|---|
| Previous Owner | Trumble John B | $50,000 |
Source: Public Records
Tax History
| Year | Tax Paid | Tax Assessment Tax Assessment Total Assessment is a certain percentage of the fair market value that is determined by local assessors to be the total taxable value of land and additions on the property. | Land | Improvement |
|---|---|---|---|---|
| 2025 | $6,204 | $72,807 | $22,288 | $50,519 |
| 2024 | $6,204 | $72,807 | $22,288 | $50,519 |
| 2023 | $6,102 | $73,787 | $24,113 | $53,359 |
| 2022 | $4,820 | $56,316 | $17,882 | $38,434 |
| 2021 | $4,596 | $57,937 | $18,397 | $39,540 |
| 2020 | $4,729 | $51,709 | $16,088 | $35,621 |
| 2019 | $4,657 | $51,709 | $16,088 | $35,621 |
| 2018 | $4,464 | $49,018 | $13,392 | $35,626 |
| 2017 | $4,331 | $54,192 | $14,806 | $39,386 |
| 2016 | $3,928 | $43,136 | $12,418 | $30,718 |
| 2015 | $3,729 | $38,383 | $20,457 | $17,926 |
| 2014 | $3,393 | $38,383 | $20,457 | $17,926 |
Source: Public Records
Map
Nearby Homes
- 7126 Cedarwood Cir
- 7266 Siena Way Unit A
- 7309 Windsor Dr
- 7088 Indian Peaks Trail
- 7096 Indian Peaks Trail
- 7358 Buckingham Ct
- 5020 Buckingham Rd Unit B2
- 5302 Pinehurst Dr
- 5292 Sun Dial Place
- 5083 Cottonwood Dr
- 7436 Singing Hills Ct Unit B
- 4935 Sundance Square
- 5325 Pinehurst Dr
- 7443 Singing Hills Ct Unit Q
- 7400 Singing Hills Dr Unit K7400
- 7411 Spy Glass Ct Unit N7411
- 7492 Singing Hills Dr Unit G7492
- 7481 Singing Hills Dr
- 7205 Rustic Trail
- 4788 Briar Ridge Trail
- 7114 Cedarwood Cir
- 7120 Cedarwood Cir
- 7112 Cedarwood Cir
- 7122 Cedarwood Cir
- 7180 Cedarwood Cir
- 7184 Cedarwood Cir
- 7176 Cedarwood Cir
- 7188 Cedarwood Cir
- 7174 Cedarwood Cir
- 7108 Cedarwood Cir
- 7106 Cedarwood Cir
- 7104 Cedarwood Cir
- 7170 Cedarwood Cir
- 7102 Cedarwood Cir
- 7130 Cedarwood Cir
- 7138 Cedarwood Cir
- 7142 Cedarwood Cir
- 7181 Cedarwood Cir
- 7185 Cedarwood Cir
- 7189 Cedarwood Cir
Your Personal Tour Guide
Ask me questions while you tour the home.