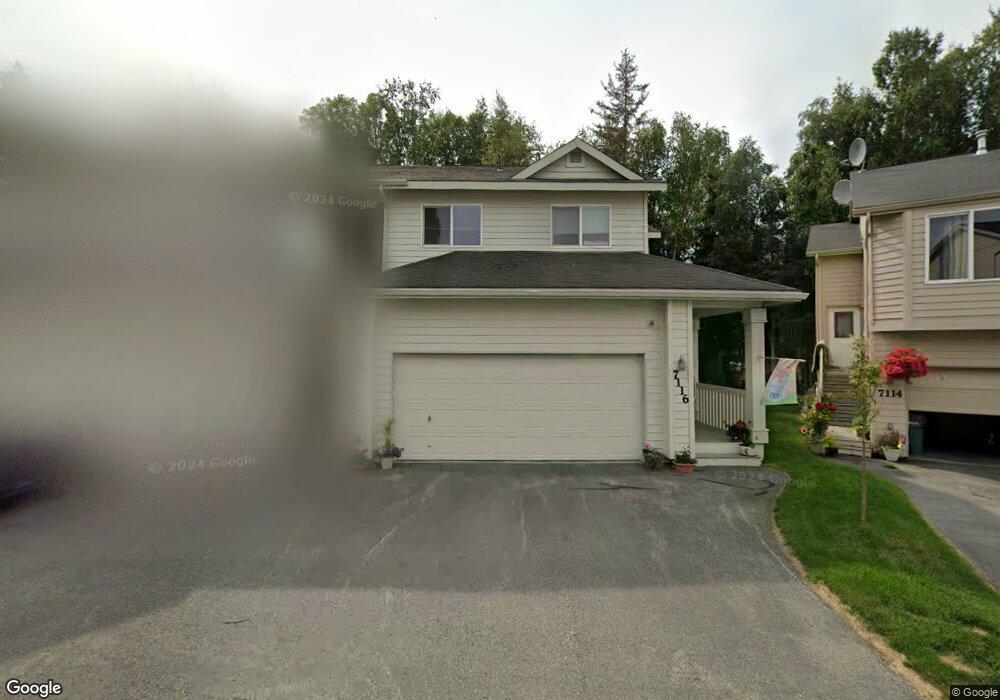
7116 Fairweather Park Loop Unit 19A Anchorage, AK 99518
Taku-Campbell NeighborhoodEstimated Value: $348,000 - $376,028
3
Beds
2
Baths
1,699
Sq Ft
$213/Sq Ft
Est. Value
About This Home
This home is located at 7116 Fairweather Park Loop Unit 19A, Anchorage, AK 99518 and is currently estimated at $362,014, approximately $213 per square foot. 7116 Fairweather Park Loop Unit 19A is a home located in Anchorage Municipality with nearby schools including Taku Elementary School, Romig Middle School, and West High School.
Ownership History
Date
Name
Owned For
Owner Type
Purchase Details
Closed on
May 15, 2013
Sold by
Teich Janice E
Bought by
Teich Janice E and Janice E Teich Declaration Of Trust
Current Estimated Value
Purchase Details
Closed on
Mar 14, 2005
Sold by
River Park Llc
Bought by
Spinell Homes Inc
Home Financials for this Owner
Home Financials are based on the most recent Mortgage that was taken out on this home.
Original Mortgage
$192,593
Outstanding Balance
$97,898
Interest Rate
5.65%
Mortgage Type
Purchase Money Mortgage
Estimated Equity
$264,116
Purchase Details
Closed on
Mar 11, 2005
Sold by
Spinell Homes Inc
Bought by
Teich Garland N and Teich Janice E
Home Financials for this Owner
Home Financials are based on the most recent Mortgage that was taken out on this home.
Original Mortgage
$192,593
Outstanding Balance
$97,898
Interest Rate
5.65%
Mortgage Type
Purchase Money Mortgage
Estimated Equity
$264,116
Create a Home Valuation Report for This Property
The Home Valuation Report is an in-depth analysis detailing your home's value as well as a comparison with similar homes in the area
Home Values in the Area
Average Home Value in this Area
Purchase History
| Date | Buyer | Sale Price | Title Company |
|---|---|---|---|
| Teich Janice E | -- | None Available | |
| Spinell Homes Inc | -- | -- | |
| Teich Garland N | -- | -- |
Source: Public Records
Mortgage History
| Date | Status | Borrower | Loan Amount |
|---|---|---|---|
| Open | Teich Garland N | $192,593 |
Source: Public Records
Tax History Compared to Growth
Tax History
| Year | Tax Paid | Tax Assessment Tax Assessment Total Assessment is a certain percentage of the fair market value that is determined by local assessors to be the total taxable value of land and additions on the property. | Land | Improvement |
|---|---|---|---|---|
| 2025 | $1,874 | $363,800 | -- | $363,800 |
| 2024 | $1,874 | $341,100 | $0 | $341,100 |
| 2023 | $5,460 | $320,600 | $0 | $320,600 |
| 2022 | $1,364 | $281,000 | $0 | $281,000 |
| 2021 | $4,889 | $271,300 | $0 | $271,300 |
| 2020 | $1,007 | $260,400 | $0 | $260,400 |
| 2019 | $1,077 | $265,800 | $0 | $265,800 |
| 2018 | $1,010 | $261,600 | $0 | $261,600 |
| 2017 | $1,483 | $264,700 | $0 | $264,700 |
| 2016 | $1,014 | $262,400 | $0 | $262,400 |
| 2015 | $1,014 | $256,700 | $0 | $256,700 |
| 2014 | $1,014 | $243,600 | $0 | $243,600 |
Source: Public Records
Map
Nearby Homes
- 720 Bridgestone Ct Unit 16
- 501 Nathan Dr Unit 5
- 607 Copperbush Ct Unit 607
- 302 Sweetgale Ct Unit 302
- 6536 Fairweather Dr Unit 613
- 6348 Fairweather Dr Unit 3
- 7827 Old Seward Hwy
- 7446 Nathan Dr
- 7441 Glade Place
- 7222 Foxridge Cir Unit 14B
- 7242 Foxridge Cir Unit 10D
- 7321 Huntsmen Cir Unit 21H
- 7311 Huntsmen Cir Unit 22F
- 1250 E 70th Ave
- 7602 Lumbis Ave Unit A2
- 311 Lynnwood Dr Unit 4
- 6405 Old Seward Hwy
- 7330 Huntsmen Cir Unit 13F
- 7801 Evander Dr
- 7510 Foxridge Way Unit 2A
- 7141 Fairweather Dr Unit 85A
- 7139 Fairweather Dr Unit 84A
- 7137 Fairweather Dr Unit 83A
- 7145 Fairweather Park Loop Unit 56A
- 7187 Fairweather Park Loop Unit 48A
- 7189 Fairweather Park Loop Unit 47A
- 7191 Fairweather Park Loop Unit 46A
- 7193 Fairweather Park Loop Unit 45A
- 7144 Fairweather Dr Unit 44A
- 7140 Fairweather Dr Unit 42A
- 7138 Fairweather Dr Unit 41A
- 7049 Fairweather Park Loop Unit 39A
- 7051 Fairweather Park Loop Unit 38A
- 7059 Fairweather Park Loop Unit 36A
- 7061 Fairweather Park Loop Unit 35A
- 7065 Fairweather Park Loop Unit 33A
- 7122 Fairweather Park Loop Unit 22A
- 7120 Fairweather Park Loop Unit 21A
- 7118 Fairweather Park Loop Unit 20A
- 7114 Fairweather Park Loop Unit 18A