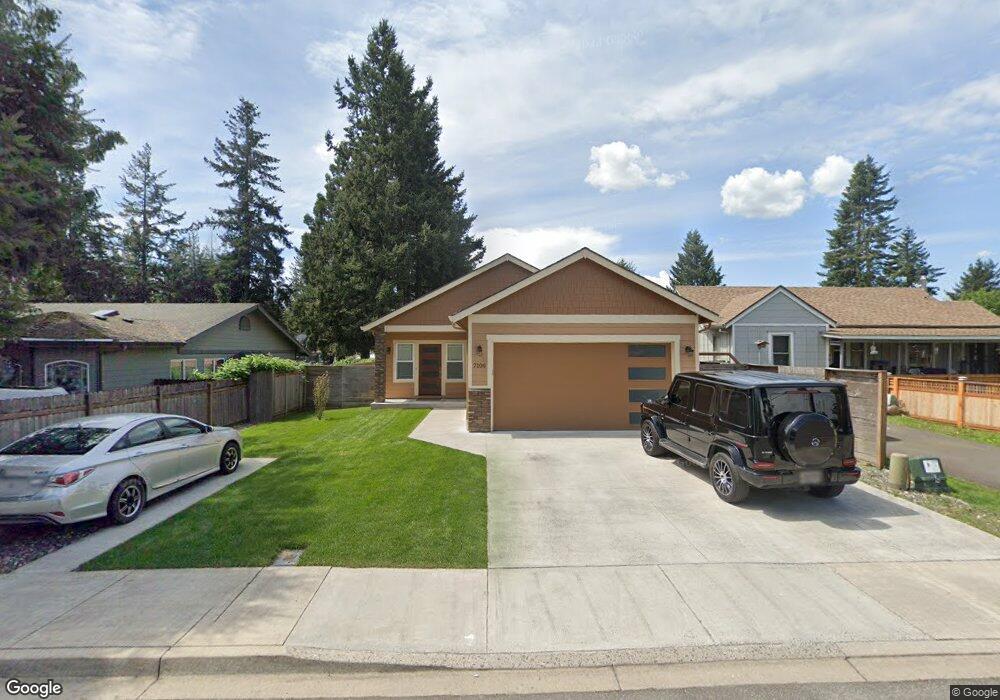
7116 NE 133rd Ave Vancouver, WA 98682
Orchards Area NeighborhoodEstimated Value: $360,000 - $385,771
3
Beds
3
Baths
1,738
Sq Ft
$217/Sq Ft
Est. Value
About This Home
This home is located at 7116 NE 133rd Ave, Vancouver, WA 98682 and is currently estimated at $376,443, approximately $216 per square foot. 7116 NE 133rd Ave is a home located in Clark County with nearby schools including Sifton Elementary School, Covington Middle School, and Heritage High School.
Ownership History
Date
Name
Owned For
Owner Type
Purchase Details
Closed on
May 27, 2021
Sold by
Lacemas Land Properties Llc
Bought by
Steif Linda M and Steif John A
Current Estimated Value
Home Financials for this Owner
Home Financials are based on the most recent Mortgage that was taken out on this home.
Original Mortgage
$225,000
Outstanding Balance
$203,709
Interest Rate
2.9%
Mortgage Type
New Conventional
Estimated Equity
$172,734
Purchase Details
Closed on
Jan 1, 2016
Sold by
Lacamas Land Properties Llc
Bought by
Steif John and Steif Linda
Home Financials for this Owner
Home Financials are based on the most recent Mortgage that was taken out on this home.
Original Mortgage
$153,000
Interest Rate
5.5%
Mortgage Type
Seller Take Back
Purchase Details
Closed on
Oct 31, 2005
Sold by
Tosh Gary L and Tosh Joanne E
Bought by
Lacamas Land Development Llc
Create a Home Valuation Report for This Property
The Home Valuation Report is an in-depth analysis detailing your home's value as well as a comparison with similar homes in the area
Home Values in the Area
Average Home Value in this Area
Purchase History
| Date | Buyer | Sale Price | Title Company |
|---|---|---|---|
| Steif Linda M | -- | Cascade Title Co | |
| Steif John | $170,000 | None Available | |
| Lacamas Land Development Llc | $170,000 | First American Title |
Source: Public Records
Mortgage History
| Date | Status | Borrower | Loan Amount |
|---|---|---|---|
| Open | Steif Linda M | $225,000 | |
| Previous Owner | Steif John | $153,000 |
Source: Public Records
Tax History Compared to Growth
Tax History
| Year | Tax Paid | Tax Assessment Tax Assessment Total Assessment is a certain percentage of the fair market value that is determined by local assessors to be the total taxable value of land and additions on the property. | Land | Improvement |
|---|---|---|---|---|
| 2025 | $527 | $362,895 | $198,315 | $164,580 |
| 2024 | $489 | $352,573 | $198,315 | $154,258 |
| 2023 | $1,216 | $370,306 | $204,417 | $165,889 |
| 2022 | $1,294 | $361,080 | $204,417 | $156,663 |
| 2021 | $1,399 | $306,326 | $173,907 | $132,419 |
| 2020 | $2,531 | $266,490 | $152,550 | $113,940 |
| 2019 | $2,251 | $226,039 | $118,800 | $107,239 |
| 2018 | $2,312 | $216,795 | $0 | $0 |
| 2017 | $1,923 | $179,662 | $0 | $0 |
| 2016 | $1,880 | $155,499 | $0 | $0 |
| 2015 | $2 | $141,682 | $0 | $0 |
| 2014 | $2 | $162,820 | $0 | $0 |
| 2013 | $2 | $154,675 | $0 | $0 |
Source: Public Records
Map
Nearby Homes
- 13605 NE 72nd St
- 6912 NE 131st Ave Unit 10
- 13012 NE 76th St
- 11025 NE 137th Ave
- 12707 NE 76th St
- 0 NE 137th Ave
- 6406 NE 139th Ct
- 13713 NE 64th Cir
- 7704 NE 124th Ave
- 14218 NE 69th St
- 6200 NE 138th Ave
- 8009 NE 139th Ave
- 8605 NE 136th Ave Unit 135
- 13001 NE 83rd St
- 8202 NE 139th Ct
- 6908 NE 144th Ct
- 13216 NE 59th St Unit 25
- 13216 NE 59th St Unit 34
- 13216 NE 59th St Unit 24
- 12801 NE 83rd St
- 7114 NE 133rd Ave
- 7112 NE 133rd Ave
- 13216 NE 71st St
- 13202 NE 71st St
- 7106 NE 133rd Ave
- 13116 NE 71st St
- 7104 NE 133rd Ave
- 7117 NE 131st Ave
- 7118 NE 133rd Ave
- 0 NE 71st St
- 7103 NE 131st Ave
- 7213 NE 131st Ave
- 7012 NE 133rd Ave
- 13111 NE 71st St
- 13201 NE 71st St
- 7109 NE 133rd Ave
- 7111 NE 133rd Ave
- 7215 NE 131st Ave
- 13312 NE 71st St
- 7018 NE 131st Ave