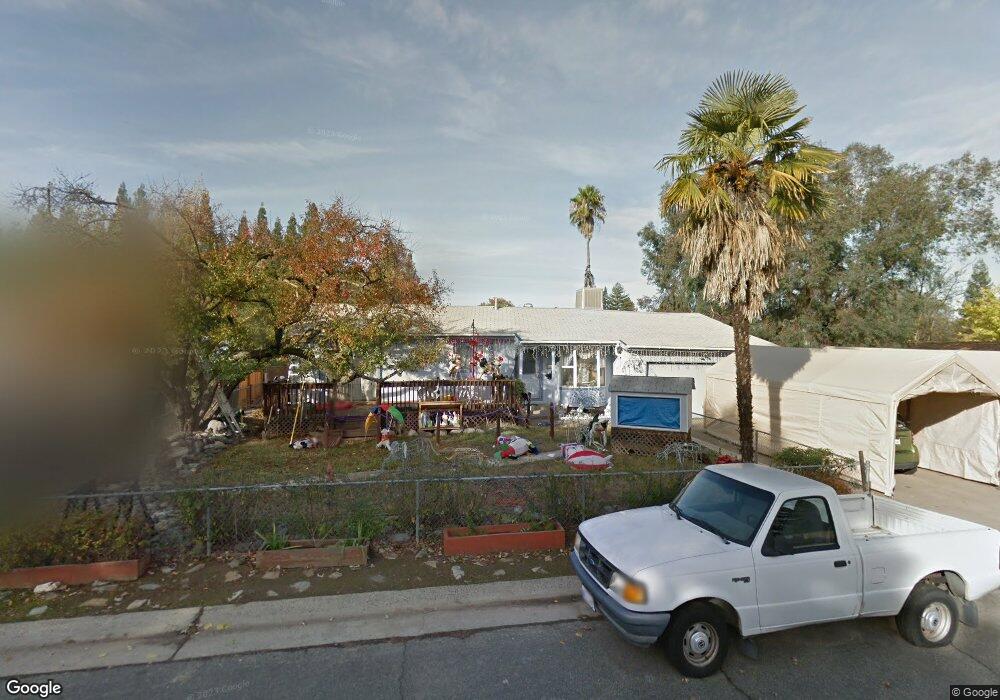
7117 Bobby St Orangevale, CA 95662
Estimated Value: $373,204 - $442,000
3
Beds
1
Bath
960
Sq Ft
$422/Sq Ft
Est. Value
About This Home
This home is located at 7117 Bobby St, Orangevale, CA 95662 and is currently estimated at $405,051, approximately $421 per square foot. 7117 Bobby St is a home located in Sacramento County with nearby schools including Oakview Community Elementary School, Louis Pasteur Fundamental Middle School, and Casa Roble Fundamental High School.
Ownership History
Date
Name
Owned For
Owner Type
Purchase Details
Closed on
Nov 5, 2019
Sold by
Barrett Charline F
Bought by
Barrett Charline F and Gunsolus Timmy Ray
Current Estimated Value
Purchase Details
Closed on
Apr 13, 1998
Sold by
Anderson Charline F and Anderson Charline F
Bought by
Barrett Richard A and Barrett Charline F
Home Financials for this Owner
Home Financials are based on the most recent Mortgage that was taken out on this home.
Original Mortgage
$74,000
Interest Rate
7.18%
Purchase Details
Closed on
Dec 2, 1994
Sold by
Anderson Charline F and Gonsolus Charline Fay
Bought by
Anderson Charline F
Home Financials for this Owner
Home Financials are based on the most recent Mortgage that was taken out on this home.
Original Mortgage
$35,000
Interest Rate
9.08%
Create a Home Valuation Report for This Property
The Home Valuation Report is an in-depth analysis detailing your home's value as well as a comparison with similar homes in the area
Home Values in the Area
Average Home Value in this Area
Purchase History
| Date | Buyer | Sale Price | Title Company |
|---|---|---|---|
| Barrett Charline F | -- | None Available | |
| Barrett Richard A | -- | Financial Title Company | |
| Anderson Charline F | -- | Fidelity National Title Ins |
Source: Public Records
Mortgage History
| Date | Status | Borrower | Loan Amount |
|---|---|---|---|
| Closed | Barrett Richard A | $74,000 | |
| Closed | Anderson Charline F | $35,000 |
Source: Public Records
Tax History
| Year | Tax Paid | Tax Assessment Tax Assessment Total Assessment is a certain percentage of the fair market value that is determined by local assessors to be the total taxable value of land and additions on the property. | Land | Improvement |
|---|---|---|---|---|
| 2025 | $505 | $45,346 | $8,346 | $37,000 |
| 2024 | $505 | $44,458 | $8,183 | $36,275 |
| 2023 | $492 | $43,587 | $8,023 | $35,564 |
| 2022 | $488 | $42,733 | $7,866 | $34,867 |
| 2021 | $480 | $41,896 | $7,712 | $34,184 |
| 2020 | $471 | $41,467 | $7,633 | $33,834 |
| 2019 | $461 | $40,655 | $7,484 | $33,171 |
| 2018 | $455 | $39,859 | $7,338 | $32,521 |
| 2017 | $449 | $39,079 | $7,195 | $31,884 |
| 2016 | $421 | $38,313 | $7,054 | $31,259 |
| 2015 | $414 | $37,739 | $6,949 | $30,790 |
| 2014 | $405 | $37,007 | $6,818 | $30,189 |
Source: Public Records
Map
Nearby Homes
- 7101 Bobby St
- 7120 Hazel Ave
- 8788 Elm Ave
- 8733 Oak Ave
- 7527 Country Oaks Ln
- 6600 Rosa Prado Ct
- 8631 Posadera Ave
- 8572 Menke Way
- 6422 Hazel Ave
- 0 Nipawin Way Unit 226012742
- 7200 Kenneth Ave
- 7001 Jenner Ct
- 7624 Larkspur Ln
- 9256 Floyd Ave
- 8391 Cranford Way
- 8465 Day Lillies Ln
- 8464 Old Ranch Rd
- 9184 Central Ave
- 8659 Blythe Ave
- 7727 Granite Ave
Your Personal Tour Guide
Ask me questions while you tour the home.