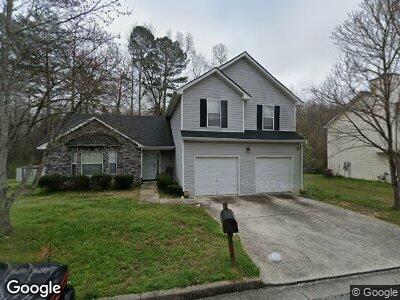
7118 Brecken Place Lithonia, GA 30058
Lithonia NeighborhoodEstimated Value: $255,000 - $280,000
3
Beds
2
Baths
1,624
Sq Ft
$164/Sq Ft
Est. Value
About This Home
This home is located at 7118 Brecken Place, Lithonia, GA 30058 and is currently estimated at $267,096, approximately $164 per square foot. 7118 Brecken Place is a home located in DeKalb County with nearby schools including Princeton Elementary School, Stephenson Middle School, and Stephenson High School.
Ownership History
Date
Name
Owned For
Owner Type
Purchase Details
Closed on
May 28, 2020
Sold by
Mupr 3 Assets Llc
Bought by
Amnl Asset Company 1 Llc
Current Estimated Value
Purchase Details
Closed on
Sep 13, 2019
Sold by
Offerpad Spvborrower 1 Llc
Bought by
Mupr 3 Assets Llc
Purchase Details
Closed on
Mar 31, 2011
Sold by
Hsbc Mtg Svcs Inc
Bought by
Trim Lorraine
Home Financials for this Owner
Home Financials are based on the most recent Mortgage that was taken out on this home.
Original Mortgage
$65,301
Interest Rate
4.75%
Mortgage Type
FHA
Purchase Details
Closed on
Aug 3, 2010
Sold by
Williams Erika
Bought by
Hsbc Mtg Svcs Inc
Purchase Details
Closed on
Jun 22, 2001
Sold by
Breckenridge Builder Group Inc
Bought by
Williams Erika
Home Financials for this Owner
Home Financials are based on the most recent Mortgage that was taken out on this home.
Original Mortgage
$128,206
Interest Rate
7.23%
Mortgage Type
FHA
Create a Home Valuation Report for This Property
The Home Valuation Report is an in-depth analysis detailing your home's value as well as a comparison with similar homes in the area
Home Values in the Area
Average Home Value in this Area
Purchase History
| Date | Buyer | Sale Price | Title Company |
|---|---|---|---|
| Amnl Asset Company 1 Llc | $164,144 | -- | |
| Mupr 3 Assets Llc | $138,300 | -- | |
| Trim Lorraine | $67,000 | -- | |
| Hsbc Mtg Svcs Inc | $54,756 | -- | |
| Williams Erika | $129,300 | -- |
Source: Public Records
Mortgage History
| Date | Status | Borrower | Loan Amount |
|---|---|---|---|
| Previous Owner | Trim Lorraine | $65,301 | |
| Previous Owner | Williams Erika | $155,000 | |
| Previous Owner | Williams Erika | $131,000 | |
| Previous Owner | Williams Erika | $128,206 |
Source: Public Records
Tax History Compared to Growth
Tax History
| Year | Tax Paid | Tax Assessment Tax Assessment Total Assessment is a certain percentage of the fair market value that is determined by local assessors to be the total taxable value of land and additions on the property. | Land | Improvement |
|---|---|---|---|---|
| 2023 | $4,145 | $85,200 | $8,520 | $76,680 |
| 2022 | $3,175 | $85,240 | $8,400 | $76,840 |
| 2021 | $3,175 | $65,200 | $8,400 | $56,800 |
| 2020 | $2,734 | $55,160 | $8,400 | $46,760 |
| 2019 | $1,504 | $53,560 | $7,240 | $46,320 |
| 2018 | $1,161 | $44,200 | $7,240 | $36,960 |
| 2017 | $1,314 | $44,000 | $7,240 | $36,760 |
| 2016 | $1,259 | $42,600 | $7,240 | $35,360 |
| 2014 | $740 | $23,800 | $7,240 | $16,560 |
Source: Public Records
Map
Nearby Homes
- 7099 Brushwood Bend
- 7109 Brushwood Bend
- 7115 Brushwood Bend
- 7121 Brushwood Bend
- 7127 Brushwood Bend
- 7133 Brushwood Bend
- 7139 Brushwood Bend
- 7145 Brushwood Bend
- 7065 Brushwood Bend
- 7065 Brushwood Bend Unit 55
- 7037 Brushwood Bend
- 7140 Brushwood Bend
- 7152 Brushwood Bend Unit LOT 109
- 7152 Brushwood Bend
- 7118 Brecken Place
- 7124 Brecken Place
- 7112 Brecken Place
- 7119 Brecken Place
- 7106 Brecken Place
- 7130 Brecken Place
- 7113 Brecken Place
- 7125 Brecken Place
- 7107 Brecken Place
- 7100 Brecken Place Unit 1
- 7100 Brecken Place
- 7131 Brecken Place
- 7136 Brecken Place
- 7021 Brecken Trace
- 7027 Brecken Trace
- 7137 Brecken Place
- 7033 Brecken Trace
- 7101 Brecken Place
- 7094 Brecken Place
- 7041 Brecken Trace