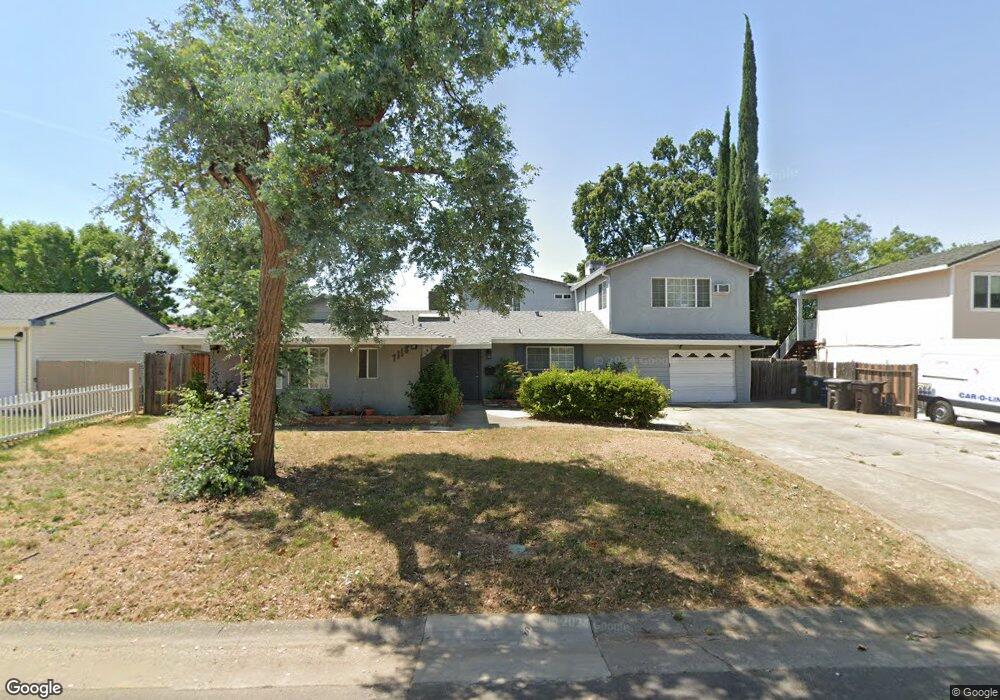
7118 Dolan Way Citrus Heights, CA 95621
Estimated Value: $431,000 - $635,000
7
Beds
4
Baths
3,214
Sq Ft
$171/Sq Ft
Est. Value
About This Home
This home is located at 7118 Dolan Way, Citrus Heights, CA 95621 and is currently estimated at $548,206, approximately $170 per square foot. 7118 Dolan Way is a home located in Sacramento County with nearby schools including Carriage Drive Elementary School, Sylvan Middle School, and Mesa Verde High School.
Ownership History
Date
Name
Owned For
Owner Type
Purchase Details
Closed on
Nov 16, 2021
Sold by
Patawaran Godofredo J and Patawaran Lourdes J
Bought by
Patawaran Godofredo J and Patawaran Lourdes J
Current Estimated Value
Home Financials for this Owner
Home Financials are based on the most recent Mortgage that was taken out on this home.
Original Mortgage
$478,800
Outstanding Balance
$438,738
Interest Rate
2.99%
Mortgage Type
New Conventional
Estimated Equity
$109,468
Purchase Details
Closed on
Nov 15, 1996
Sold by
Patawaran Fred and Patawaran Lou
Bought by
Patawaran Godofredo J and Patawaran Lourdes J
Home Financials for this Owner
Home Financials are based on the most recent Mortgage that was taken out on this home.
Original Mortgage
$136,000
Interest Rate
7.91%
Create a Home Valuation Report for This Property
The Home Valuation Report is an in-depth analysis detailing your home's value as well as a comparison with similar homes in the area
Home Values in the Area
Average Home Value in this Area
Purchase History
| Date | Buyer | Sale Price | Title Company |
|---|---|---|---|
| Patawaran Godofredo J | -- | New Title Company Name | |
| Patawaran Godofredo J | -- | Lennar Title | |
| Patawaran Godofredo J | -- | Lennar Title | |
| Patawaran Godofredo J | -- | Old Republic Title Company |
Source: Public Records
Mortgage History
| Date | Status | Borrower | Loan Amount |
|---|---|---|---|
| Open | Patawaran Godofredo J | $478,800 | |
| Closed | Patawaran Godofredo J | $478,800 | |
| Previous Owner | Patawaran Godofredo J | $136,000 |
Source: Public Records
Tax History Compared to Growth
Tax History
| Year | Tax Paid | Tax Assessment Tax Assessment Total Assessment is a certain percentage of the fair market value that is determined by local assessors to be the total taxable value of land and additions on the property. | Land | Improvement |
|---|---|---|---|---|
| 2025 | $3,534 | $299,454 | $50,971 | $248,483 |
| 2024 | $3,534 | $293,583 | $49,972 | $243,611 |
| 2023 | $3,444 | $287,828 | $48,993 | $238,835 |
| 2022 | $3,426 | $282,185 | $48,033 | $234,152 |
| 2021 | $3,370 | $276,653 | $47,092 | $229,561 |
| 2020 | $3,307 | $273,818 | $46,610 | $227,208 |
| 2019 | $3,240 | $268,450 | $45,697 | $222,753 |
| 2018 | $3,203 | $263,187 | $44,801 | $218,386 |
| 2017 | $3,172 | $258,027 | $43,923 | $214,104 |
| 2016 | $2,963 | $252,968 | $43,062 | $209,906 |
| 2015 | $2,912 | $249,170 | $42,416 | $206,754 |
| 2014 | $2,851 | $244,290 | $41,586 | $202,704 |
Source: Public Records
Map
Nearby Homes
- 7058 Enright Dr
- 7006 Enright Dr
- 7255 Minuet Way
- 7409 Circlet Way
- 7136 Baranga Dr
- 7215 Coronet Ct
- 7116 Grenola Way
- 7542 Pomerol Ln
- 7205 Princess Ct
- 6936 Winlock Ave
- 7105 Ansley Ct
- 77066 Lauppe Ln
- 6829 Kittery Ave
- 7783 Live Oak Way
- 77020 Lauppe Ln
- 0 Muth Ln Unit 225125594
- 7019 Carriage Dr
- 6862 Westchester Way
- 7025 Auburn Blvd
- 77012 Lauppe Ln