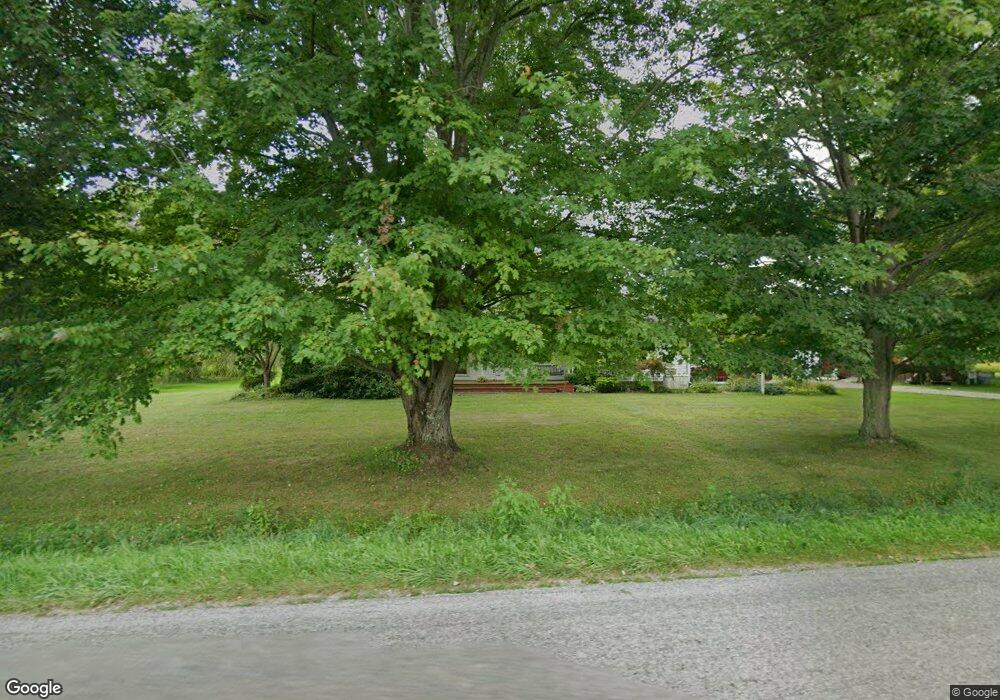
7118 Hatches Corners Rd Conneaut, OH 44030
Estimated Value: $223,000 - $293,000
4
Beds
2
Baths
1,210
Sq Ft
$206/Sq Ft
Est. Value
About This Home
This home is located at 7118 Hatches Corners Rd, Conneaut, OH 44030 and is currently estimated at $249,009, approximately $205 per square foot. 7118 Hatches Corners Rd is a home located in Ashtabula County with nearby schools including Lakeshore Primary Elementary School, Gateway Elementary School, and Conneaut Middle School.
Ownership History
Date
Name
Owned For
Owner Type
Purchase Details
Closed on
Sep 26, 2009
Sold by
Collins Everett L and Collins Christine
Bought by
Anthony Christopher M and Anthony Julie R
Current Estimated Value
Home Financials for this Owner
Home Financials are based on the most recent Mortgage that was taken out on this home.
Original Mortgage
$129,600
Outstanding Balance
$85,101
Interest Rate
5.19%
Mortgage Type
New Conventional
Estimated Equity
$163,908
Purchase Details
Closed on
May 10, 2006
Sold by
Collins Everett L and Collins Christine
Bought by
Collins Everett L and Collins Christine
Create a Home Valuation Report for This Property
The Home Valuation Report is an in-depth analysis detailing your home's value as well as a comparison with similar homes in the area
Home Values in the Area
Average Home Value in this Area
Purchase History
| Date | Buyer | Sale Price | Title Company |
|---|---|---|---|
| Anthony Christopher M | $144,000 | Chicago Title Agency | |
| Collins Everett L | -- | None Available |
Source: Public Records
Mortgage History
| Date | Status | Borrower | Loan Amount |
|---|---|---|---|
| Open | Anthony Christopher M | $129,600 |
Source: Public Records
Tax History Compared to Growth
Tax History
| Year | Tax Paid | Tax Assessment Tax Assessment Total Assessment is a certain percentage of the fair market value that is determined by local assessors to be the total taxable value of land and additions on the property. | Land | Improvement |
|---|---|---|---|---|
| 2024 | $3,987 | $58,070 | $10,750 | $47,320 |
| 2023 | $2,460 | $58,070 | $10,750 | $47,320 |
| 2022 | $2,020 | $42,070 | $8,260 | $33,810 |
| 2021 | $2,073 | $42,070 | $8,260 | $33,810 |
| 2020 | $2,073 | $42,070 | $8,260 | $33,810 |
| 2019 | $1,867 | $36,930 | $8,260 | $28,670 |
| 2018 | $1,800 | $36,930 | $8,260 | $28,670 |
| 2017 | $1,643 | $36,650 | $8,260 | $28,390 |
| 2016 | $1,505 | $33,530 | $7,560 | $25,970 |
| 2015 | $1,503 | $33,530 | $7,560 | $25,970 |
| 2014 | $1,448 | $33,530 | $7,560 | $25,970 |
| 2013 | $1,739 | $39,310 | $6,580 | $32,730 |
Source: Public Records
Map
Nearby Homes
- 9455 State Line Rd
- 529 Furnace Rd
- 5264 Middle Rd
- 6421 Weaver Rd
- 6232 Weaver Rd
- 370 E Underridge Rd
- 593 Furnace Rd
- 5958 Weaver Rd
- 522 Furnace Rd
- 0 Center Rd
- 0 Griffey Rd
- 5581 Hatches Corners Rd
- 0 Dorman Rd
- 5051 Center Rd
- VL Center Rd
- 136 W Under Ridge Rd
- 396 Bell St
- 4361 Middle Rd
- 264 High St
- 18 Hillcrest Ct
- 460 Hatches Corners Rd
- 7172 Hatches Corners Rd
- 7088 Hatches Corners Rd
- 6000 Furnace Rd
- 7068 Hatches Corners Rd
- 5982 Furnace Rd
- 5988 Furnace Rd
- 500 Hatches Corners Rd
- 5991 Furnace Rd
- 7029 Hatches Corners Rd
- 7194 Hatches Corners Rd
- V/L Hatches Corners Rd
- 518 Hatches Corners Rd
- 7012 Hatches Corners Rd
- 7262 Hatches Corners Rd
- 990 Furnace Rd
- 5961 Furnace Rd
- 7272 Hatches Corners Rd
- 532 Hatches Corners Rd
- 980 Furnace Rd