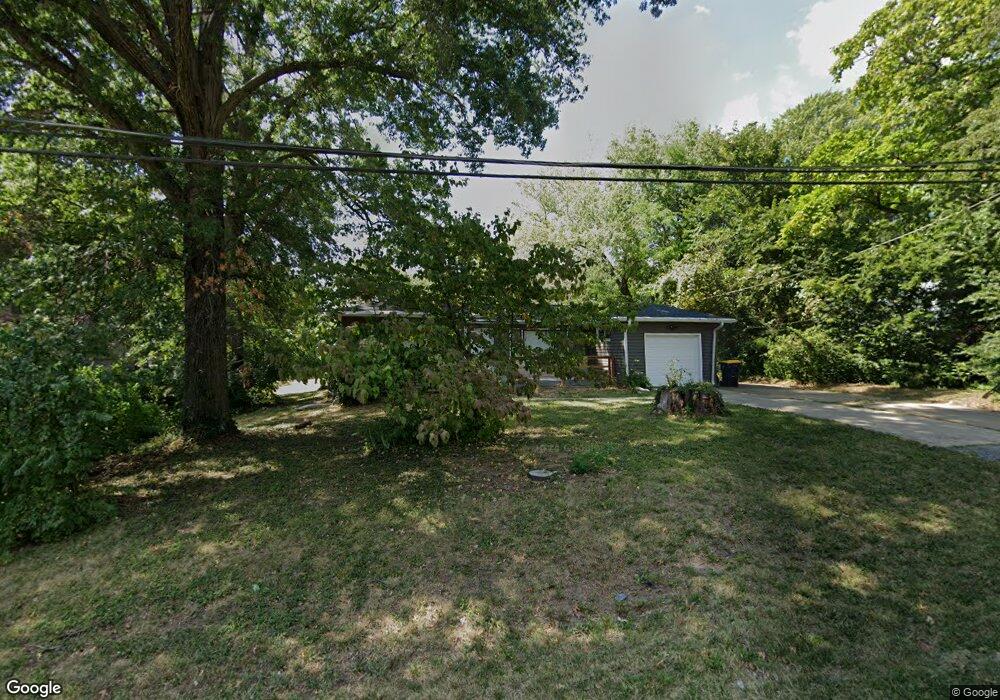
7118 James A Reed Rd Kansas City, MO 64133
Park Farms NeighborhoodEstimated Value: $193,000 - $242,000
3
Beds
2
Baths
1,048
Sq Ft
$204/Sq Ft
Est. Value
About This Home
This home is located at 7118 James A Reed Rd, Kansas City, MO 64133 and is currently estimated at $213,647, approximately $203 per square foot. 7118 James A Reed Rd is a home located in Jackson County with nearby schools including Westridge Elementary School, South Middle School, and Carver Christian Academy.
Ownership History
Date
Name
Owned For
Owner Type
Purchase Details
Closed on
Jul 10, 2025
Sold by
Orr Sarah and Orr Kristopher
Bought by
7118 James A Reed Road
Current Estimated Value
Purchase Details
Closed on
Nov 12, 2024
Sold by
7118 James A Reed Road and Zono Holdings Mo Llc
Bought by
Ark Management Llc
Purchase Details
Closed on
Feb 28, 2024
Sold by
Ark Management Llc
Bought by
Zono Holdings Mo Llc
Purchase Details
Closed on
Jan 22, 2021
Sold by
Zoom Rei Llc
Bought by
Ark Management Llc
Home Financials for this Owner
Home Financials are based on the most recent Mortgage that was taken out on this home.
Original Mortgage
$115,000
Interest Rate
2.67%
Mortgage Type
Future Advance Clause Open End Mortgage
Purchase Details
Closed on
Jul 22, 2015
Sold by
Shafer Terry
Bought by
Campbell Pamela S
Create a Home Valuation Report for This Property
The Home Valuation Report is an in-depth analysis detailing your home's value as well as a comparison with similar homes in the area
Home Values in the Area
Average Home Value in this Area
Purchase History
| Date | Buyer | Sale Price | Title Company |
|---|---|---|---|
| 7118 James A Reed Road | -- | None Listed On Document | |
| Ark Management Llc | -- | None Listed On Document | |
| Zono Holdings Mo Llc | -- | None Listed On Document | |
| Ark Management Llc | -- | Freedom Title | |
| Zoom Rel Llc | -- | Freedom Title | |
| Campbell Pamela S | -- | None Available |
Source: Public Records
Mortgage History
| Date | Status | Borrower | Loan Amount |
|---|---|---|---|
| Previous Owner | Ark Management Llc | $115,000 |
Source: Public Records
Tax History Compared to Growth
Tax History
| Year | Tax Paid | Tax Assessment Tax Assessment Total Assessment is a certain percentage of the fair market value that is determined by local assessors to be the total taxable value of land and additions on the property. | Land | Improvement |
|---|---|---|---|---|
| 2025 | $2,371 | $26,132 | $5,789 | $20,343 |
| 2024 | $2,371 | $26,195 | $5,936 | $20,259 |
| 2023 | $2,356 | $26,195 | $4,005 | $22,190 |
| 2022 | $1,849 | $19,760 | $4,210 | $15,550 |
| 2021 | $1,848 | $19,760 | $4,210 | $15,550 |
| 2020 | $1,777 | $18,774 | $4,210 | $14,564 |
| 2019 | $1,744 | $18,774 | $4,210 | $14,564 |
| 2018 | $1,511 | $16,339 | $3,664 | $12,675 |
| 2017 | $1,463 | $16,339 | $3,664 | $12,675 |
| 2016 | $1,463 | $15,930 | $3,327 | $12,603 |
| 2014 | $1,426 | $15,466 | $3,230 | $12,236 |
Source: Public Records
Map
Nearby Homes
- 7138 Sycamore Ave
- 6385 Manchester Ave
- 8016 E 75th St
- 8716 E 74th St
- 7612 Sycamore Ave
- 7626 Sycamore Ave
- 7628 Booth Ave
- 7632 Booth Ave
- 8620 Countryshire Ln
- 6714 Richmond Ave
- 7012 Kentucky Ave
- 6707 Richmond Ave
- 8812 E 72nd Terrace
- 8805 E 75th St
- 7705 Wallace Ave
- 6924 Hunter St
- 7036 Hunter St
- 7810 E 66th St
- 7867 James A Reed Rd
- 7835 Donnelly Ave
- 7104 James A Reed Rd
- 7120 James A Reed Rd
- 8100 E 72nd St
- 7102 James A Reed Rd
- 7115 James A Reed Rd
- 7200 James A Reed Rd
- 7119 James A Reed Rd
- 7105 James A Reed Rd
- 8107 E 72nd St
- 8008 E 72nd St
- 7206 James A Reed Rd
- 7205 James A Reed Rd
- 8206 E 72nd St
- 8121 E Gregory Blvd
- 7103 James A Reed Rd
- 8015 NE 72nd Terrace
- 8015 E Gregory Blvd
- 8210 E 72nd St
- 7207 James A Reed Rd
- 7139 Sycamore Ave